Fig. 17.
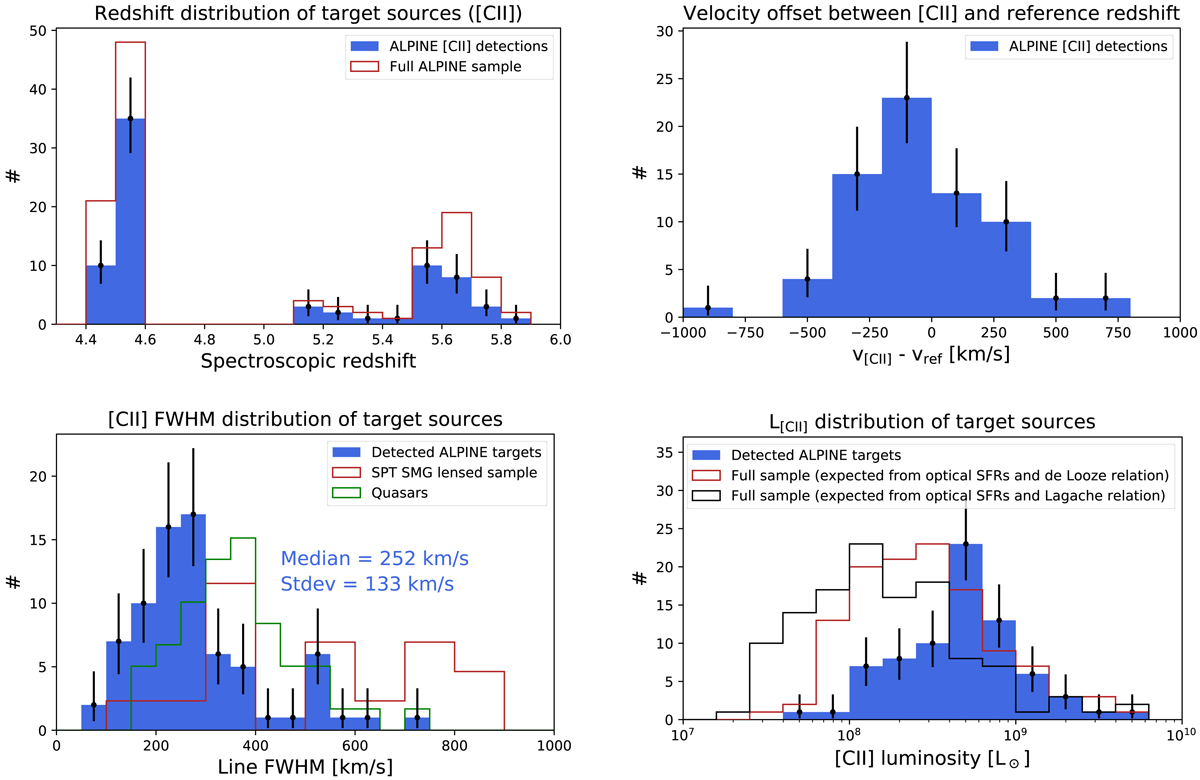
Upper left panel: redshift distribution of the full sample (red open histogram) and the [CII] detections (blue filled histogram). Upper right panel: distribution of the velocity offset between the [CII] and the reference optical redshift. Lower left panel: distribution of the [CII] line FWHM of the detected ALPINE sources (blue filled histogram) and comparison with the lensed galaxy sample of Gullberg et al. (2015, red) and the quasar sample of Decarli et al. (2018, green). Lower right panel: comparison between the [CII] luminosity distribution of the detections (blue filled histogram) and the expected values based on the SFRs determined by optical and near-infrared SED fitting and the De Looze et al. (2014, red open histogram) and Lagache et al. (2018, black open histogram) relations.
Current usage metrics show cumulative count of Article Views (full-text article views including HTML views, PDF and ePub downloads, according to the available data) and Abstracts Views on Vision4Press platform.
Data correspond to usage on the plateform after 2015. The current usage metrics is available 48-96 hours after online publication and is updated daily on week days.
Initial download of the metrics may take a while.