Fig. 2.
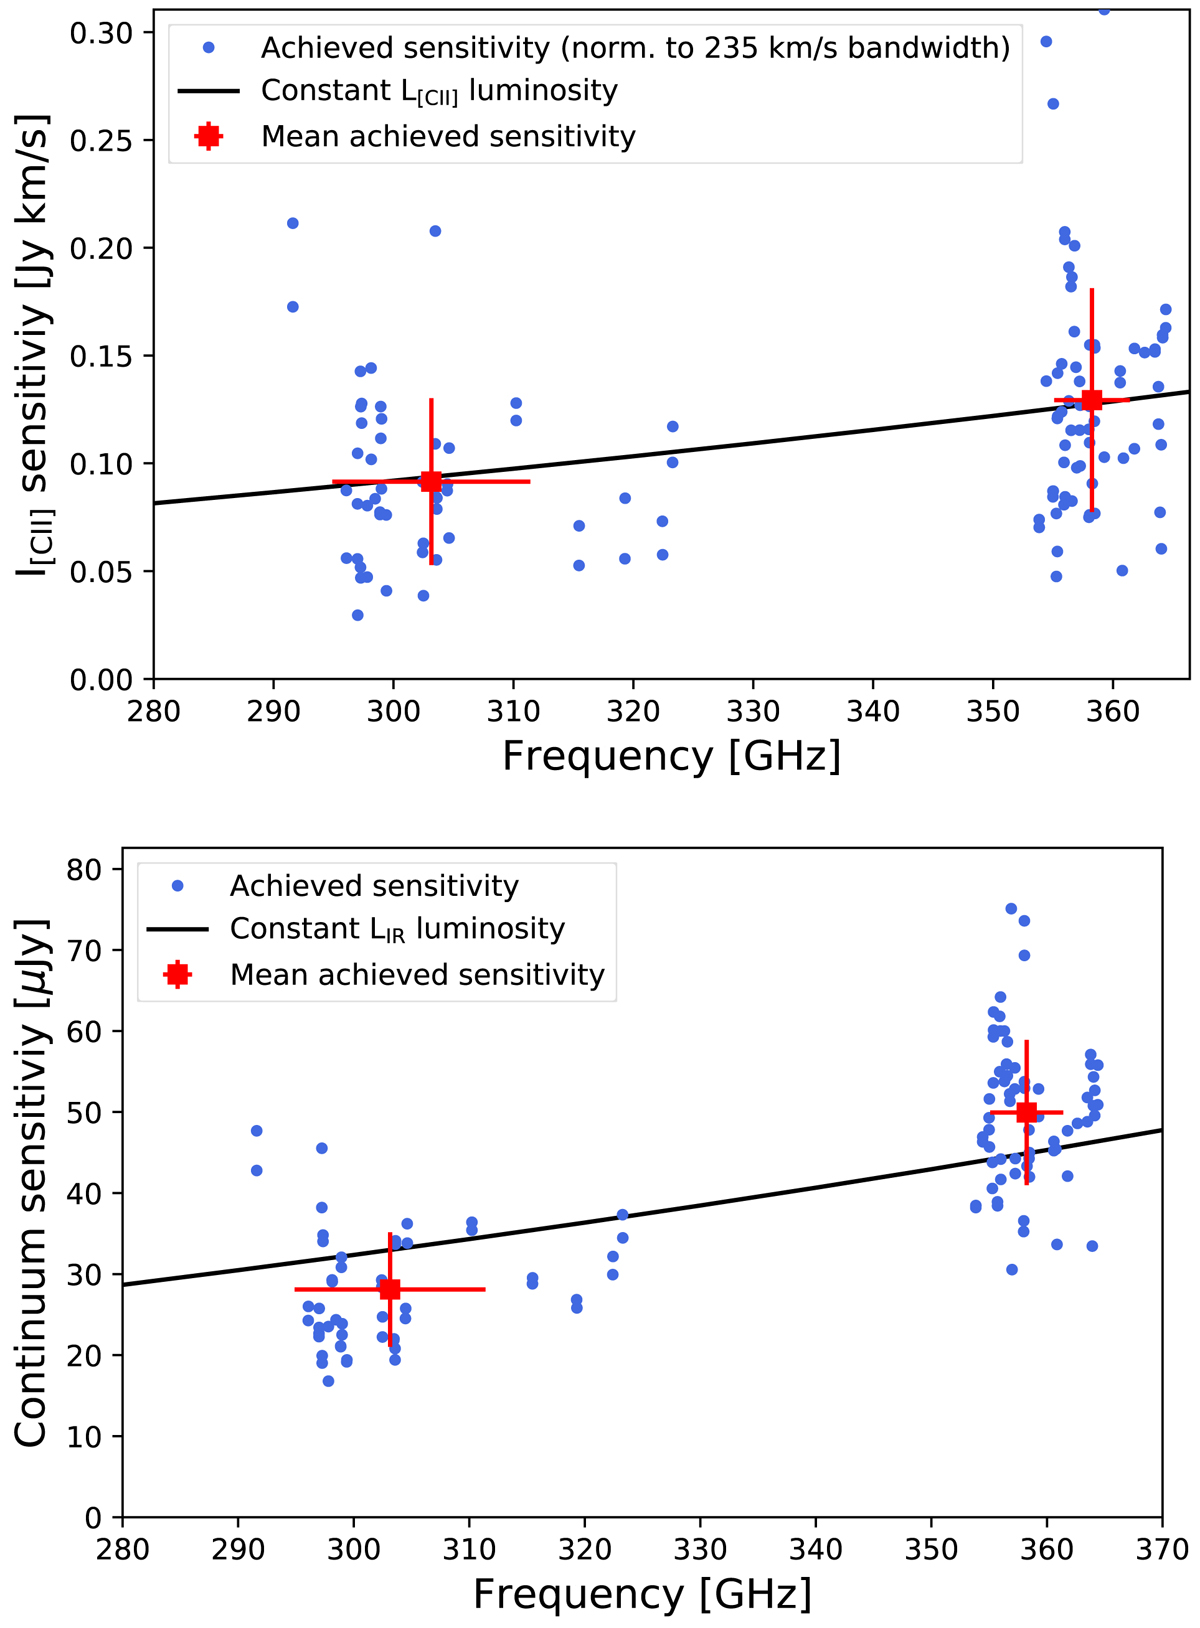
Achieved [CII] (upper panel) and continuum (lower panel) rms sensitivities. The blue dots indicate the values measured in individual fields and the red squares the mean values in the two redshift windows. The red error bars on the plots are the standard deviation in each redshift range. The actual uncertainties on the mean values are indeed ![]() times smaller (central-limit theorem) and are smaller than the size of the squares. Since the [CII] sensitivities were measured using different bandwidths because of the different line widths, we normalized the measurements to a bandwidth of 235 km s−1 by dividing our raw measurements by
times smaller (central-limit theorem) and are smaller than the size of the squares. Since the [CII] sensitivities were measured using different bandwidths because of the different line widths, we normalized the measurements to a bandwidth of 235 km s−1 by dividing our raw measurements by ![]() . The solid black lines indicate the trend of the [CII] flux I[CII] and continuum flux S(1 + z)158 μm versus frequency (and thus redshift) at constant [CII] luminosity L[CII] and fixed infrared luminosity LIR, respectively.
. The solid black lines indicate the trend of the [CII] flux I[CII] and continuum flux S(1 + z)158 μm versus frequency (and thus redshift) at constant [CII] luminosity L[CII] and fixed infrared luminosity LIR, respectively.
Current usage metrics show cumulative count of Article Views (full-text article views including HTML views, PDF and ePub downloads, according to the available data) and Abstracts Views on Vision4Press platform.
Data correspond to usage on the plateform after 2015. The current usage metrics is available 48-96 hours after online publication and is updated daily on week days.
Initial download of the metrics may take a while.