Open Access
Fig. C.1.
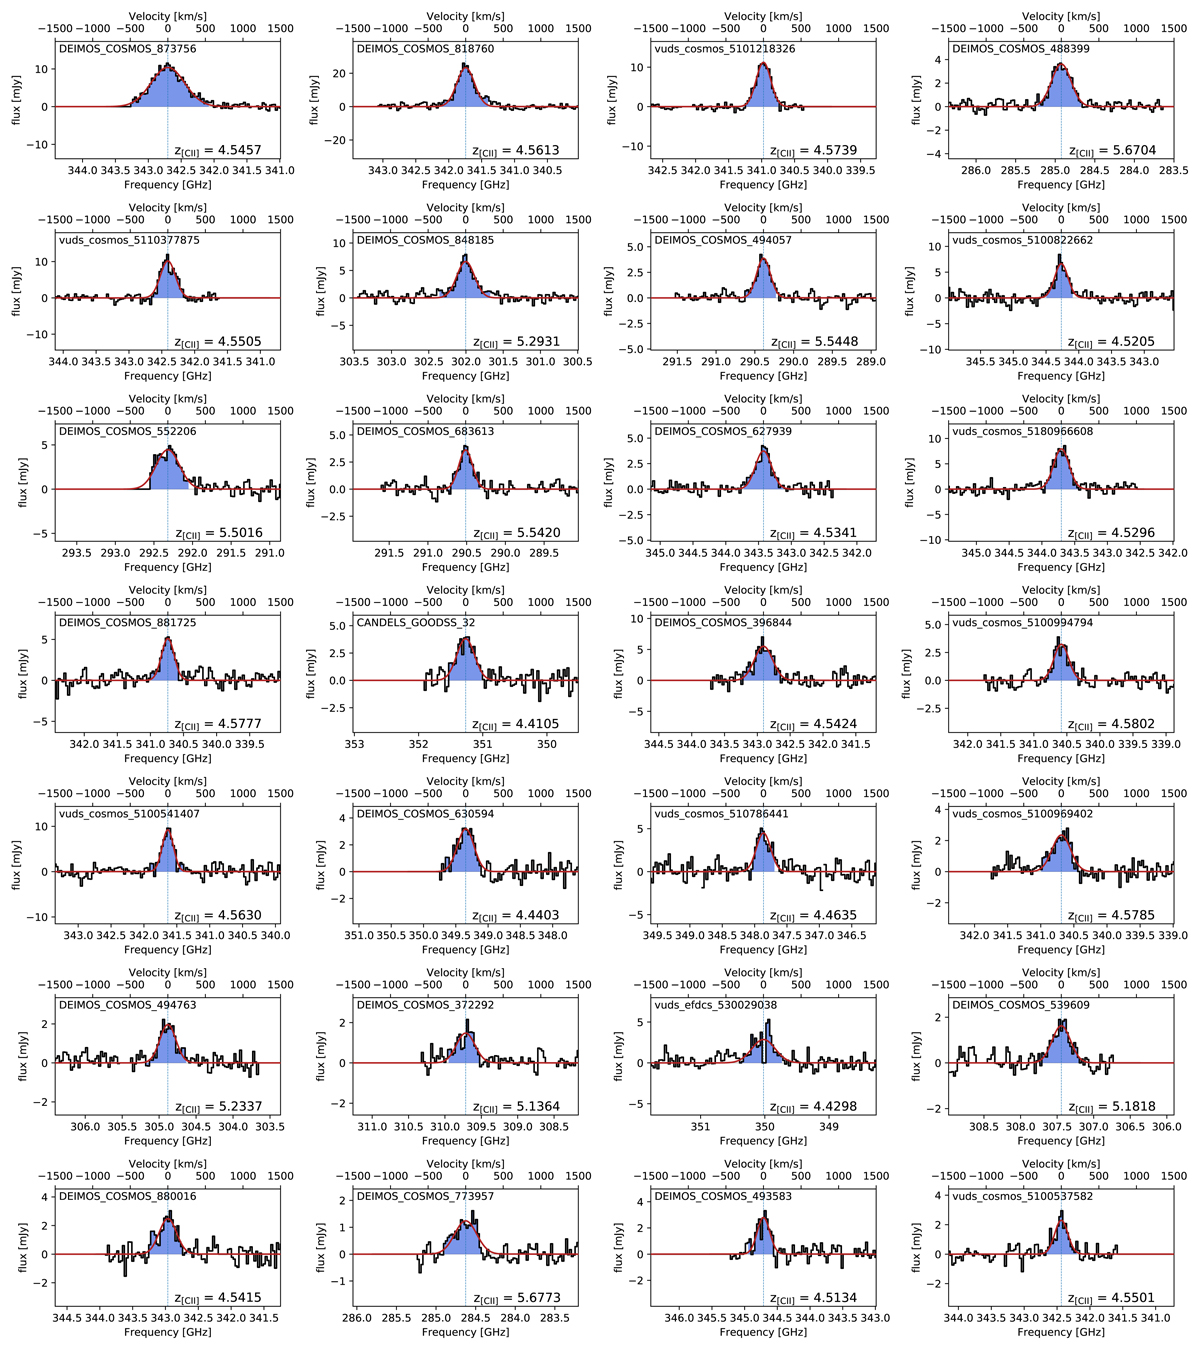
Spectra of the detected ALPINE sources (S/N > 3.5). The blue area is the frequency range used to produce the moment-0 map. The red solid line is the best-fit by a Gaussian. The process used to produce these spectra is described in Sect. 6.1.
Current usage metrics show cumulative count of Article Views (full-text article views including HTML views, PDF and ePub downloads, according to the available data) and Abstracts Views on Vision4Press platform.
Data correspond to usage on the plateform after 2015. The current usage metrics is available 48-96 hours after online publication and is updated daily on week days.
Initial download of the metrics may take a while.