Open Access
Fig. 3.
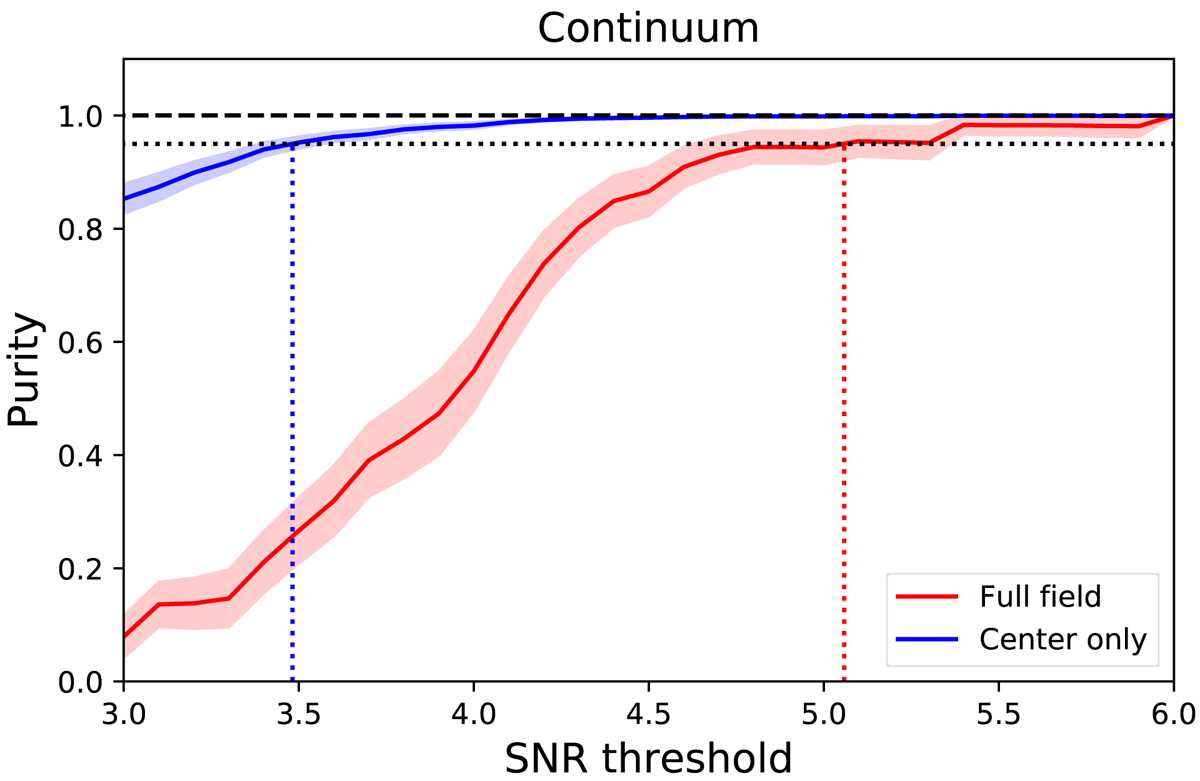
Purity as a function of the S/N threshold. The results obtained around the center of the pointings (1 arcsec radius) are in blue. The results in the full field are in red. The dotted lines show the S/N at which the 95% is reached.
Current usage metrics show cumulative count of Article Views (full-text article views including HTML views, PDF and ePub downloads, according to the available data) and Abstracts Views on Vision4Press platform.
Data correspond to usage on the plateform after 2015. The current usage metrics is available 48-96 hours after online publication and is updated daily on week days.
Initial download of the metrics may take a while.