Fig. 4.
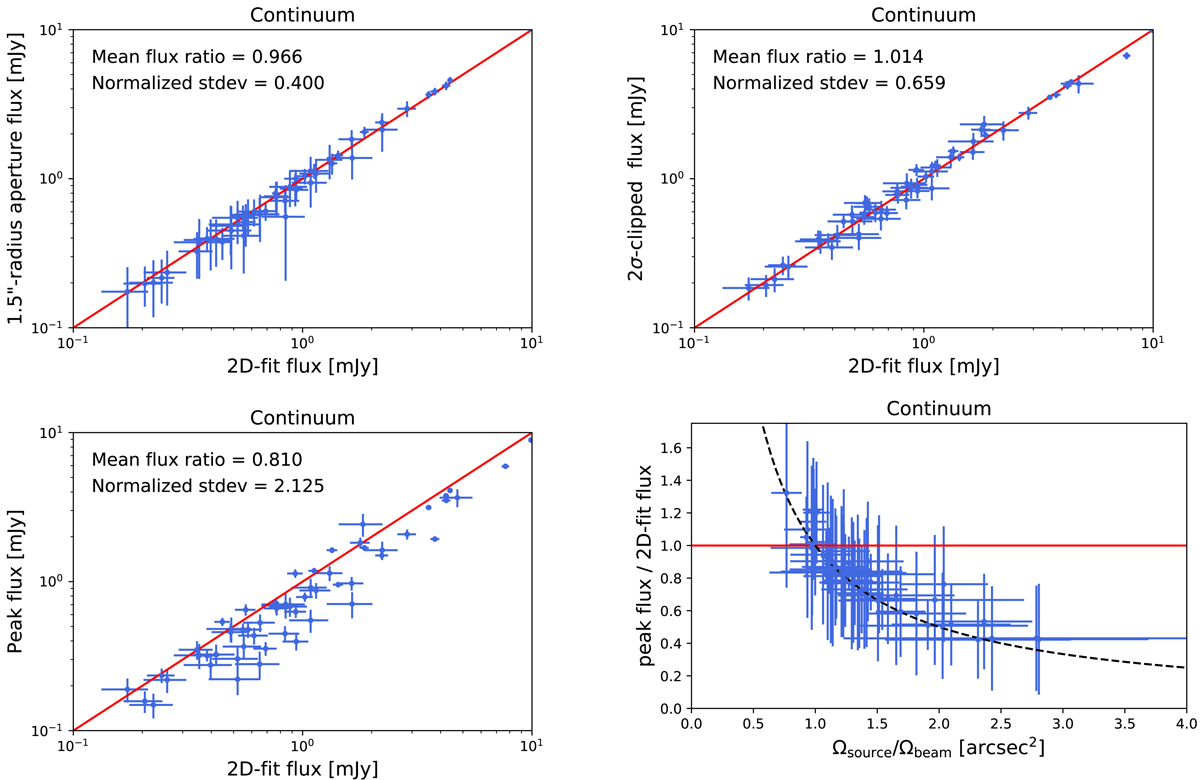
Comparison between our various photometric methods described in Sect. 3.2 for S/N > 5 sources. The blue dots are our measurements and the red line is the one-to-one relation. Upper left, upper right, and lower left panels: comparison between the 2D-fit flux density (x-axis) and the aperture, 2σ-clipped, and peak flux densities, respectively. Lower right panel: ratio between the peak flux and the 2D-fit flux as a function of the ratio between the source area (convolved by the synthesized beam) and the synthesized beam area. The dashed line indicates the expected trend (see Sect. 3.5).
Current usage metrics show cumulative count of Article Views (full-text article views including HTML views, PDF and ePub downloads, according to the available data) and Abstracts Views on Vision4Press platform.
Data correspond to usage on the plateform after 2015. The current usage metrics is available 48-96 hours after online publication and is updated daily on week days.
Initial download of the metrics may take a while.