Fig. 6.
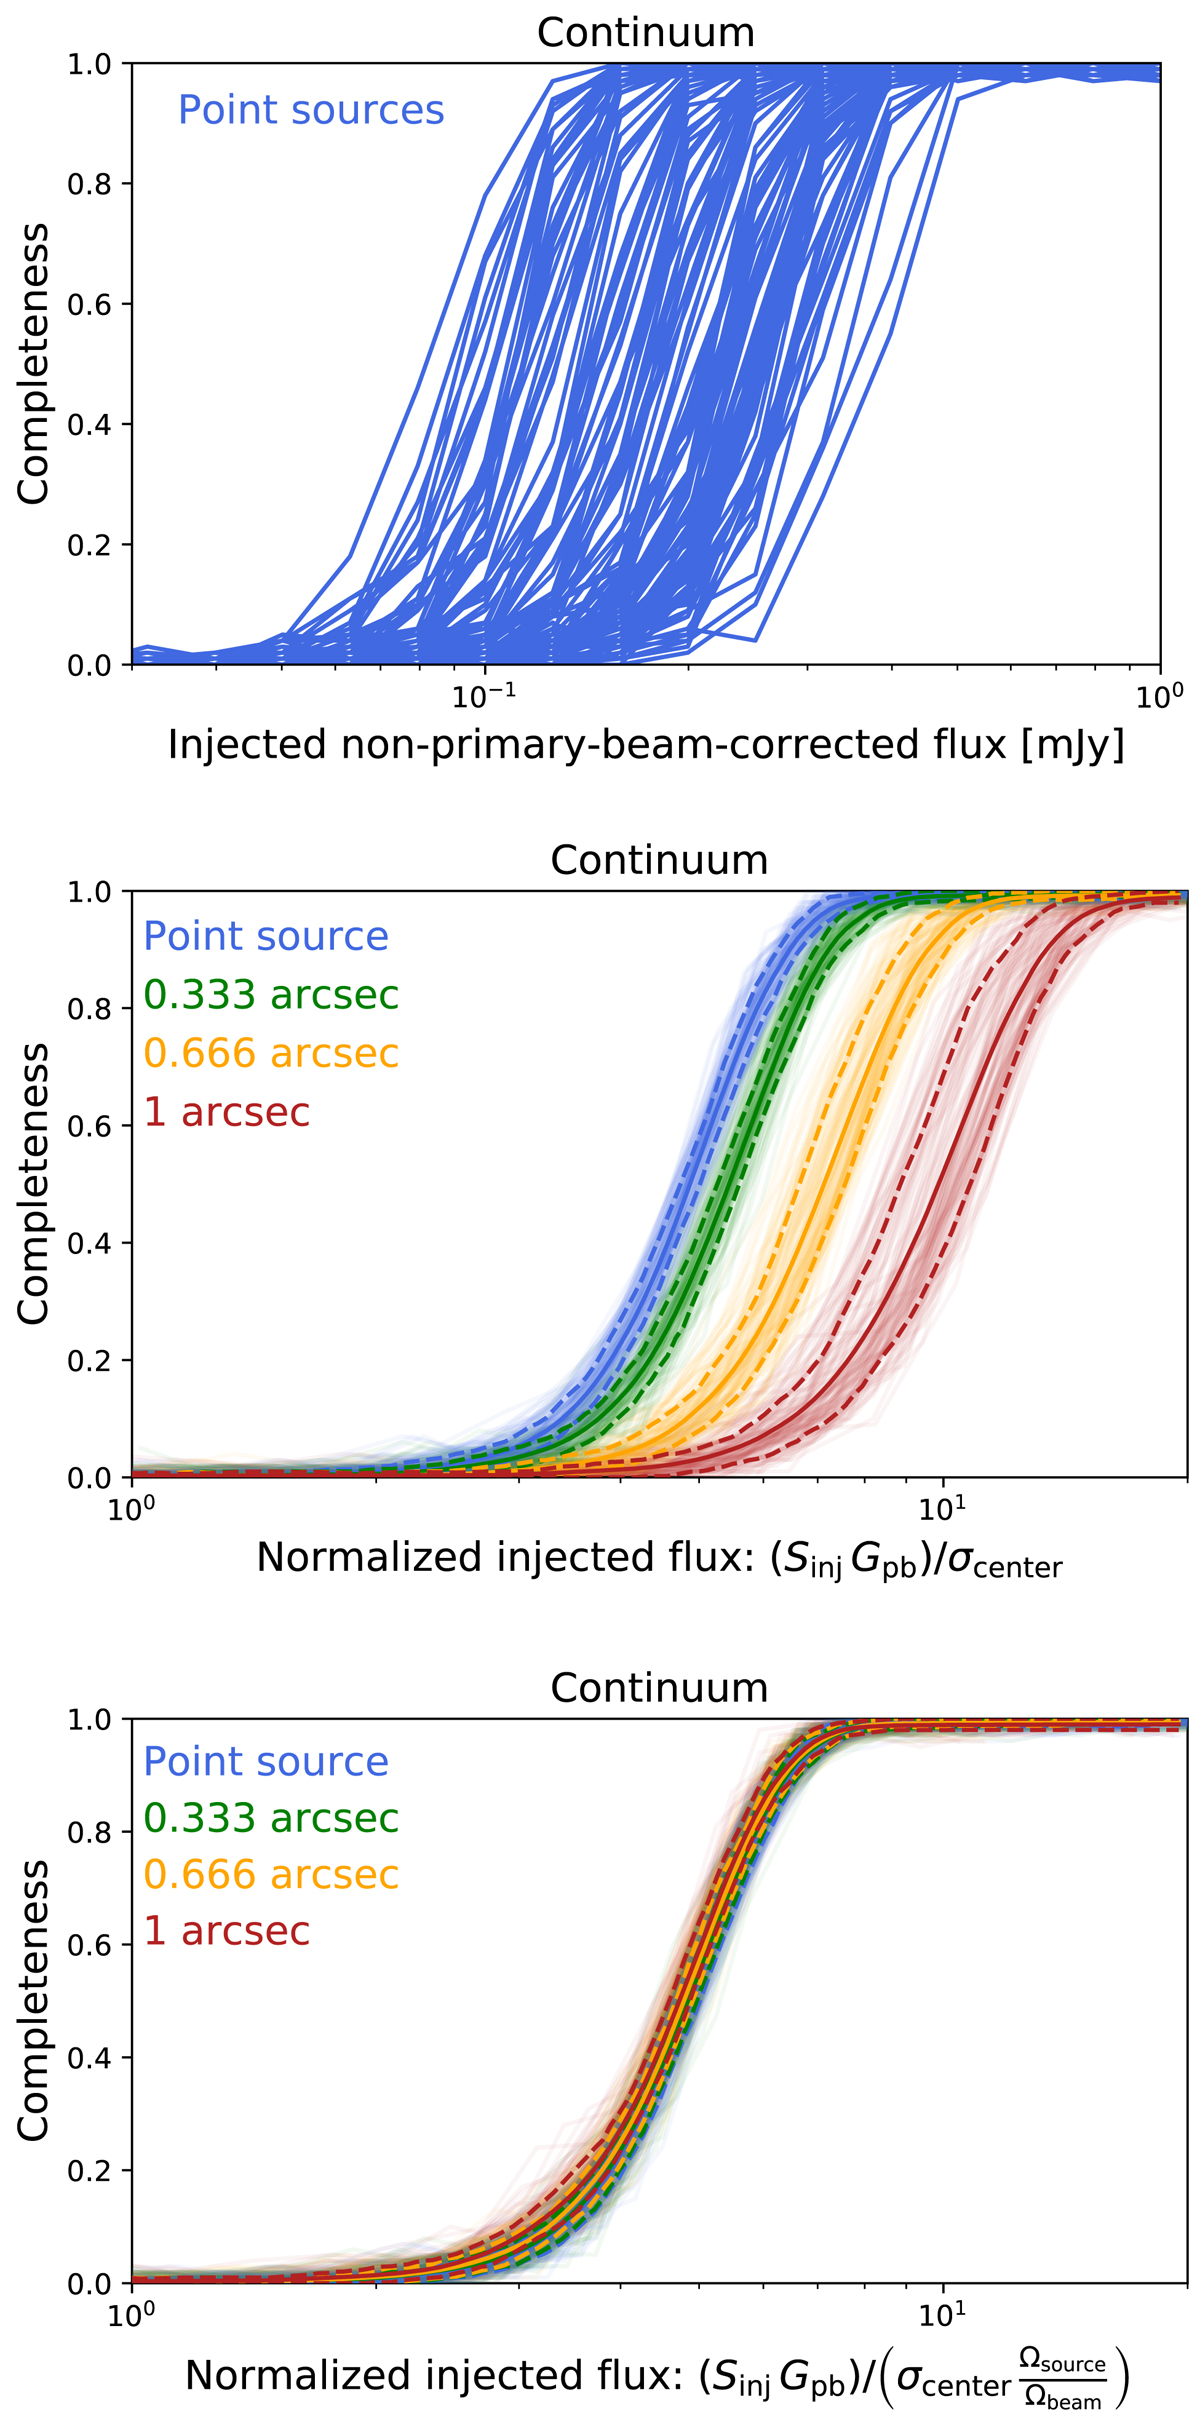
Upper panel: completeness as a function of the continuum nonprimary-beam-corrected flux density (Gpb Sinj) achieved for point sources in various pointings. Middle panel: similar figure after having divided the nonprimary-beam-corrected flux by the noise at the center of each pointing (σcenter). Various colors (blue, green, yellow, and red) corresponds to various injected source sizes (FWHM = 0, 0.333, 0.666, and 1 arcsec, respectively). The solid lines indicate the mean trend of the various pointings, while the dashed lines indicate the 1-σ envelop. Lower panel: same plot after normalizing the injected flux by 1/σcenter and by the source area (Ωsource/Ωbeam). These results are discussed in Sect. 3.8.
Current usage metrics show cumulative count of Article Views (full-text article views including HTML views, PDF and ePub downloads, according to the available data) and Abstracts Views on Vision4Press platform.
Data correspond to usage on the plateform after 2015. The current usage metrics is available 48-96 hours after online publication and is updated daily on week days.
Initial download of the metrics may take a while.