Fig. 7.
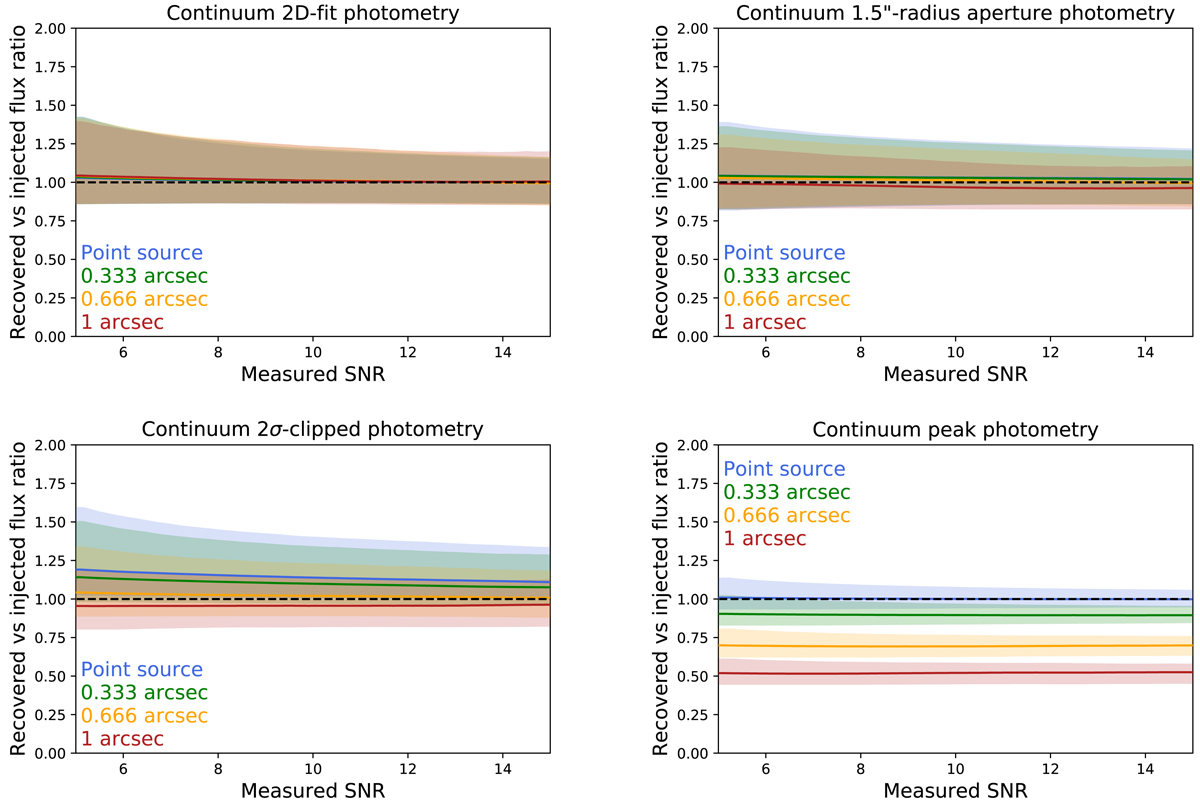
Ratio between the injected and recovered flux density as a function of measured S/N (see Sect. 3.9). Upper left, upper right, lower left, and lower right panels: results obtained for the 2D-fit, aperture, 2 σ-clipped, and peak photometry, respectively. The solid lines indicate the median and the shaded areas are the 1-σ contours. Various colors (blue, green, yellow, and red) are used to indicate the various sizes used (FWHM = 0, 0.333, 0.666, and 1 arcsec, respectively). The dashed horizontal line indicate the one-to-one relation.
Current usage metrics show cumulative count of Article Views (full-text article views including HTML views, PDF and ePub downloads, according to the available data) and Abstracts Views on Vision4Press platform.
Data correspond to usage on the plateform after 2015. The current usage metrics is available 48-96 hours after online publication and is updated daily on week days.
Initial download of the metrics may take a while.