Fig. 9.
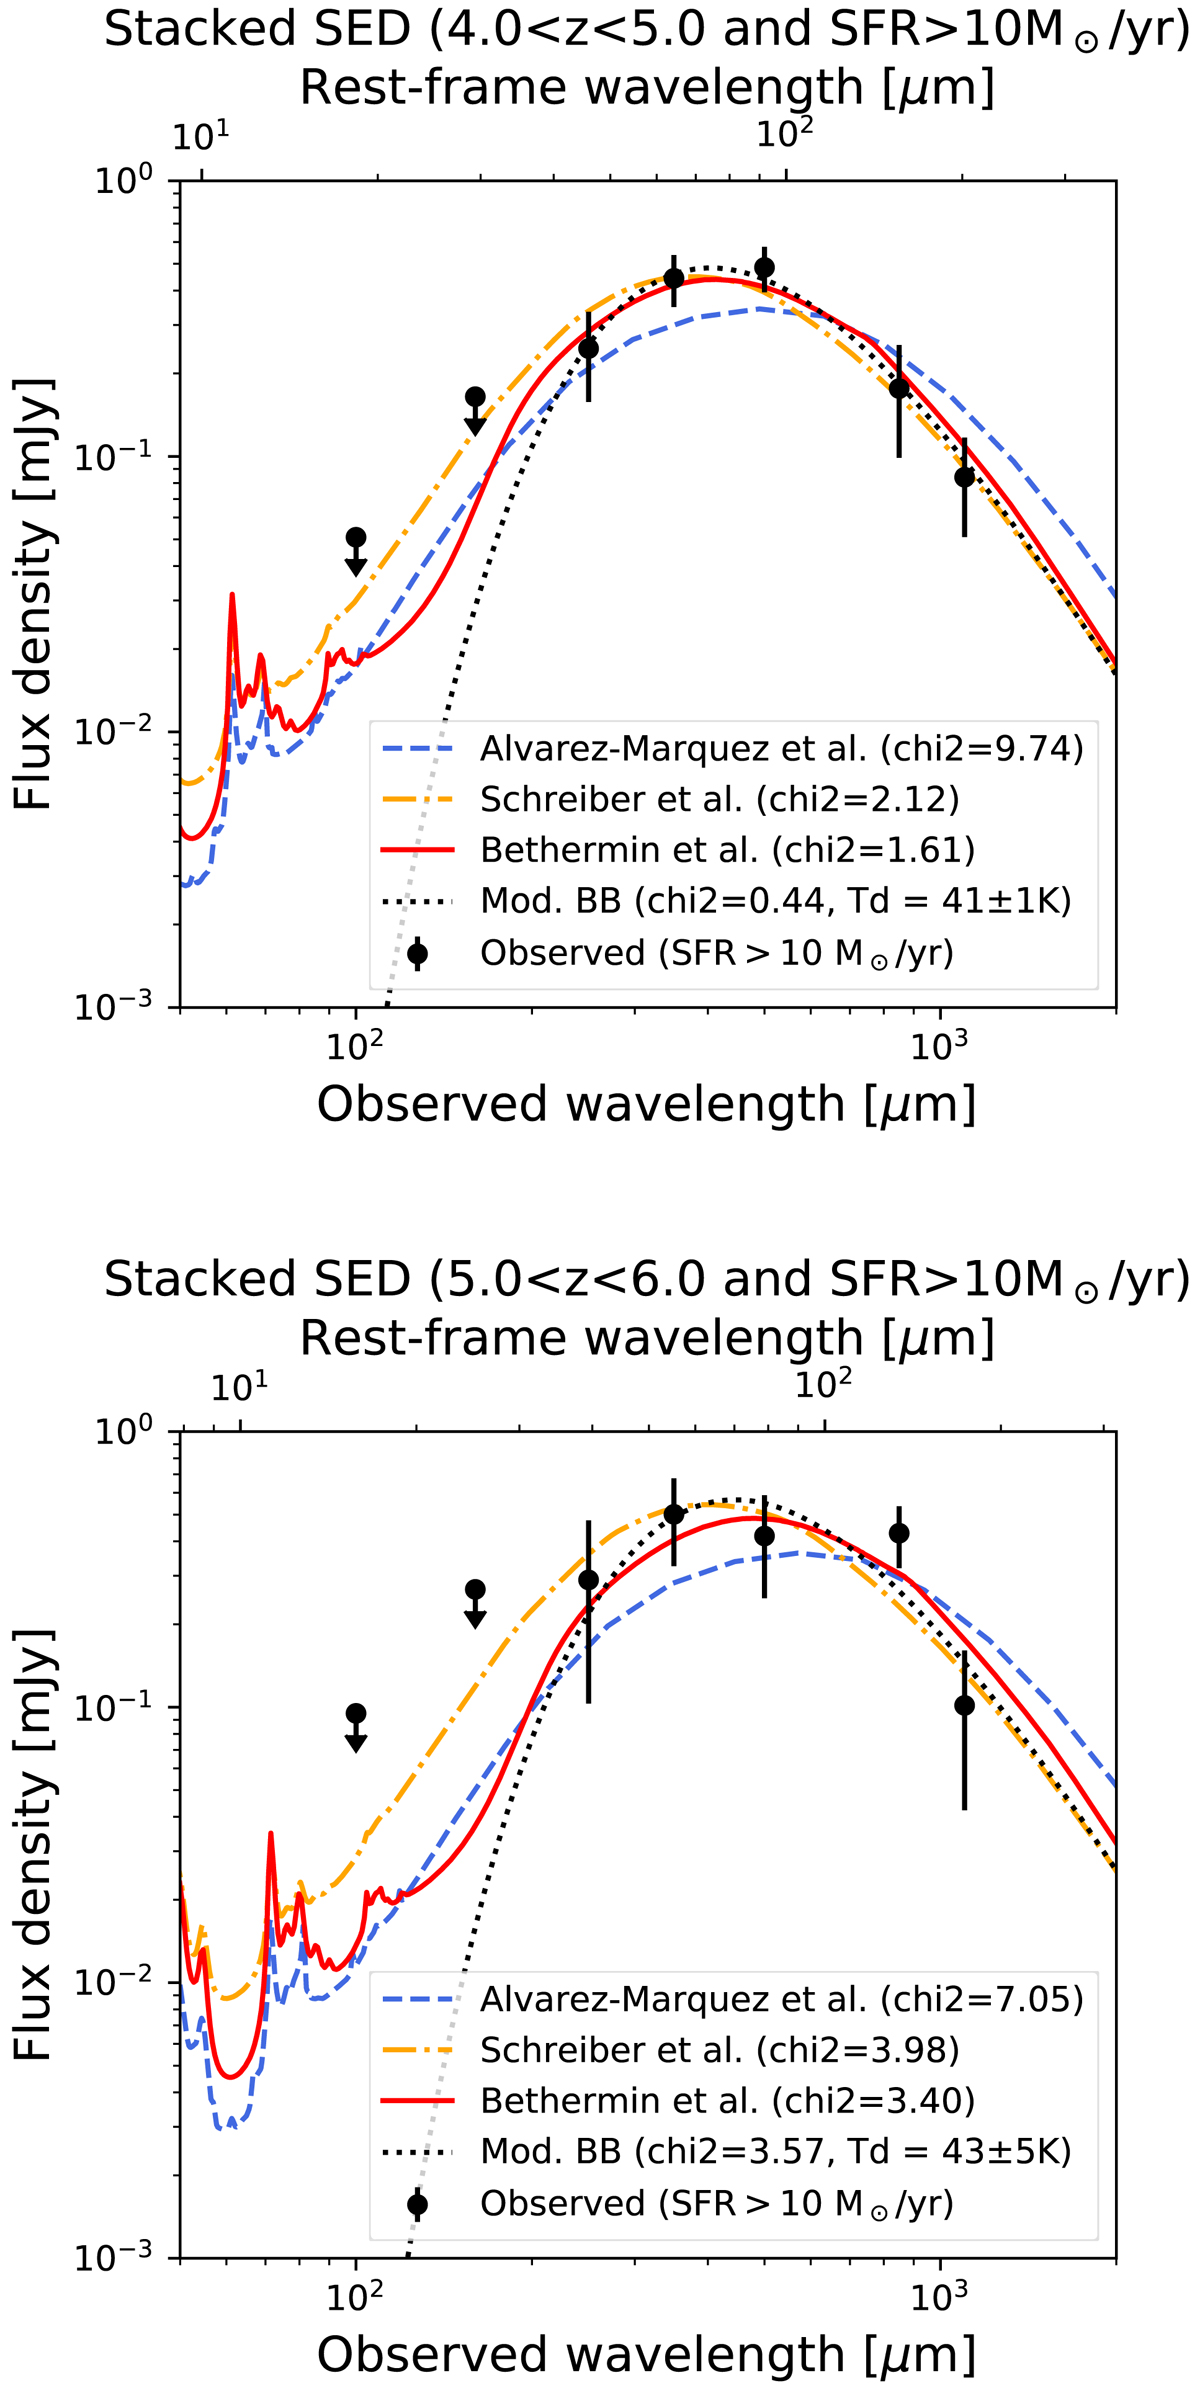
Comparison between the Álvarez-Márquez et al. (2016, blue dashed line), Schreiber et al. (2018, orange dot-dashed line), and Bethermin et al. (2017, red solid line) IR SED templates and the observed mean SEDs of SFR > 10 M⊙ yr−1 galaxies measured by stacking (black dots, see Sect. 4.2). The black dotted line is the best fit of the λrest − frame > 40 μm data points by a modified blackbody with β fixed to 1.8 (the temperature in the legend is provided in the rest frame). Upper and lower panels: 4 < z < 5 and 5 < z < 6, respectively.
Current usage metrics show cumulative count of Article Views (full-text article views including HTML views, PDF and ePub downloads, according to the available data) and Abstracts Views on Vision4Press platform.
Data correspond to usage on the plateform after 2015. The current usage metrics is available 48-96 hours after online publication and is updated daily on week days.
Initial download of the metrics may take a while.