Fig. 2.
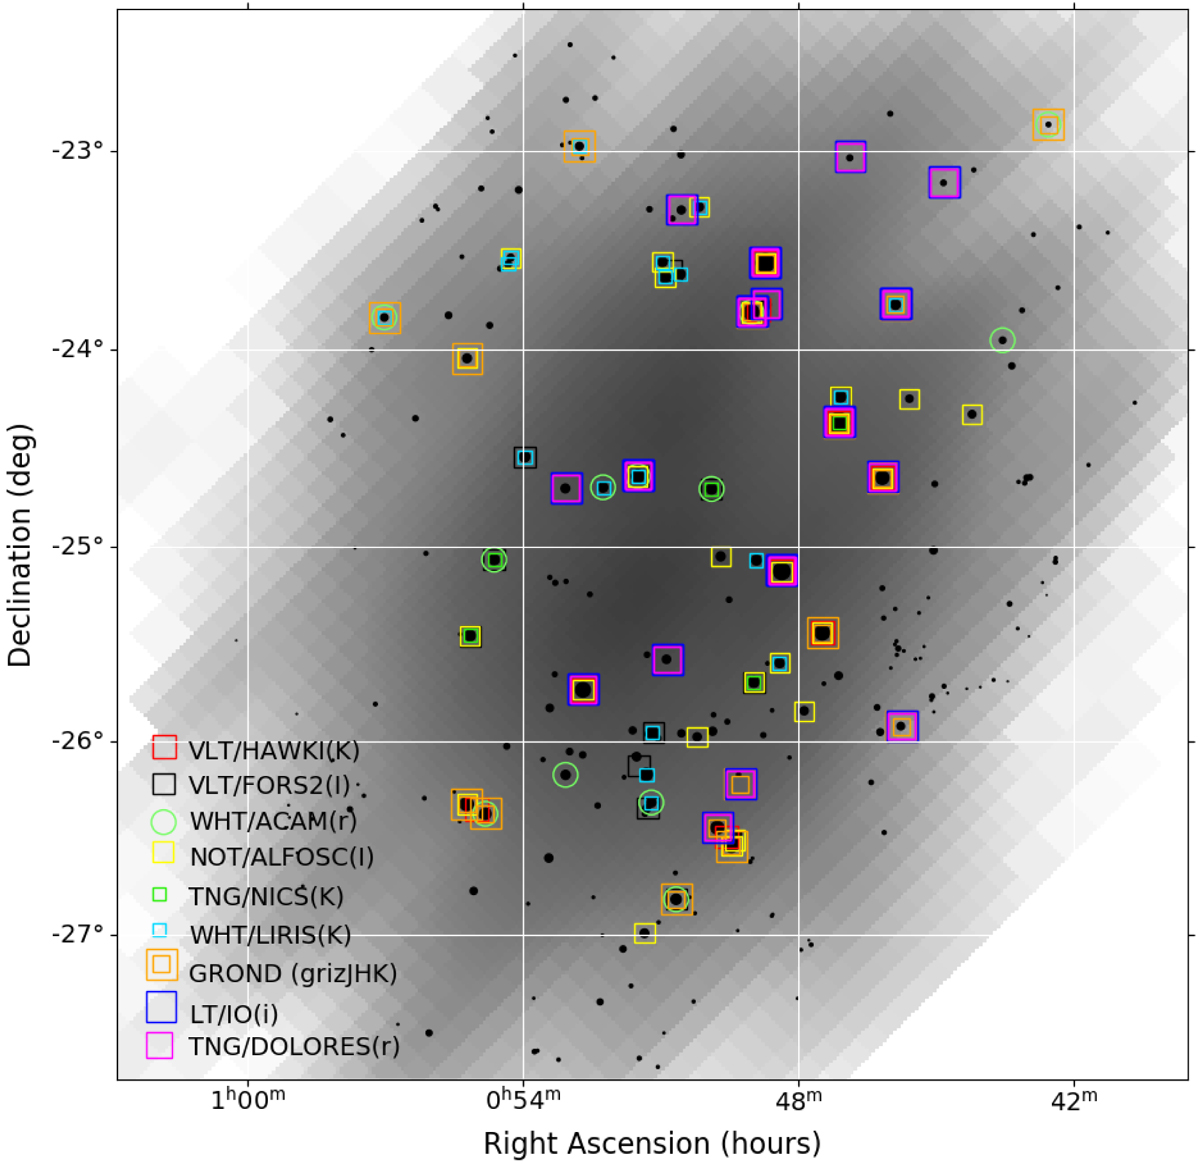
LVC skymap of S190814bv (LALInference.v1.fits) in greyscale, with galaxies selected through HOGWARTS over-plotted (black dots). Only the higher probability Northern region of the skymap is included, since the Southern region was not followed up by ENGRAVE. The size of the symbol of each galaxy (i.e. the black dots) is proportional to the probability of hosting the GW event (see Table B.1) given the skymap and a weighing scheme following Arcavi et al. (2017a). The various instruments are illustrated with different colours as in the figure legend, and the typical limiting magnitudes and filters used are given in Table B.1.
Current usage metrics show cumulative count of Article Views (full-text article views including HTML views, PDF and ePub downloads, according to the available data) and Abstracts Views on Vision4Press platform.
Data correspond to usage on the plateform after 2015. The current usage metrics is available 48-96 hours after online publication and is updated daily on week days.
Initial download of the metrics may take a while.