Fig. 4.
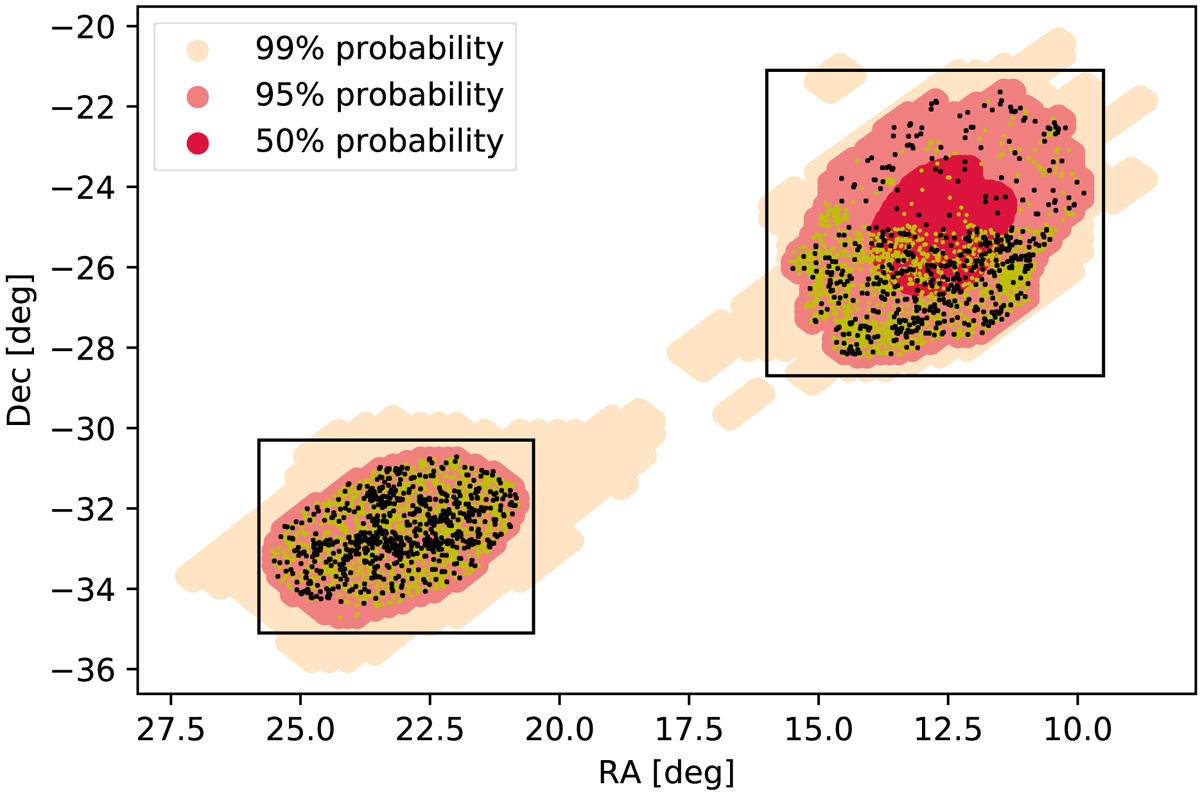
50, 95, and 99% probability regions for S190814bv. Boxes indicate the northern and southern regions of the map as discussed in the text. Galaxies which have a spectroscopic redshift in NED, and lie within the 95% contour at a distance ±3σ that of S190814bv are marked in black; galaxies with an inconsistent spectroscopic redshift are plotted in yellow. The inhomogeneous coverage of NED in the northern contour is clearly visible.
Current usage metrics show cumulative count of Article Views (full-text article views including HTML views, PDF and ePub downloads, according to the available data) and Abstracts Views on Vision4Press platform.
Data correspond to usage on the plateform after 2015. The current usage metrics is available 48-96 hours after online publication and is updated daily on week days.
Initial download of the metrics may take a while.