Fig. 6.
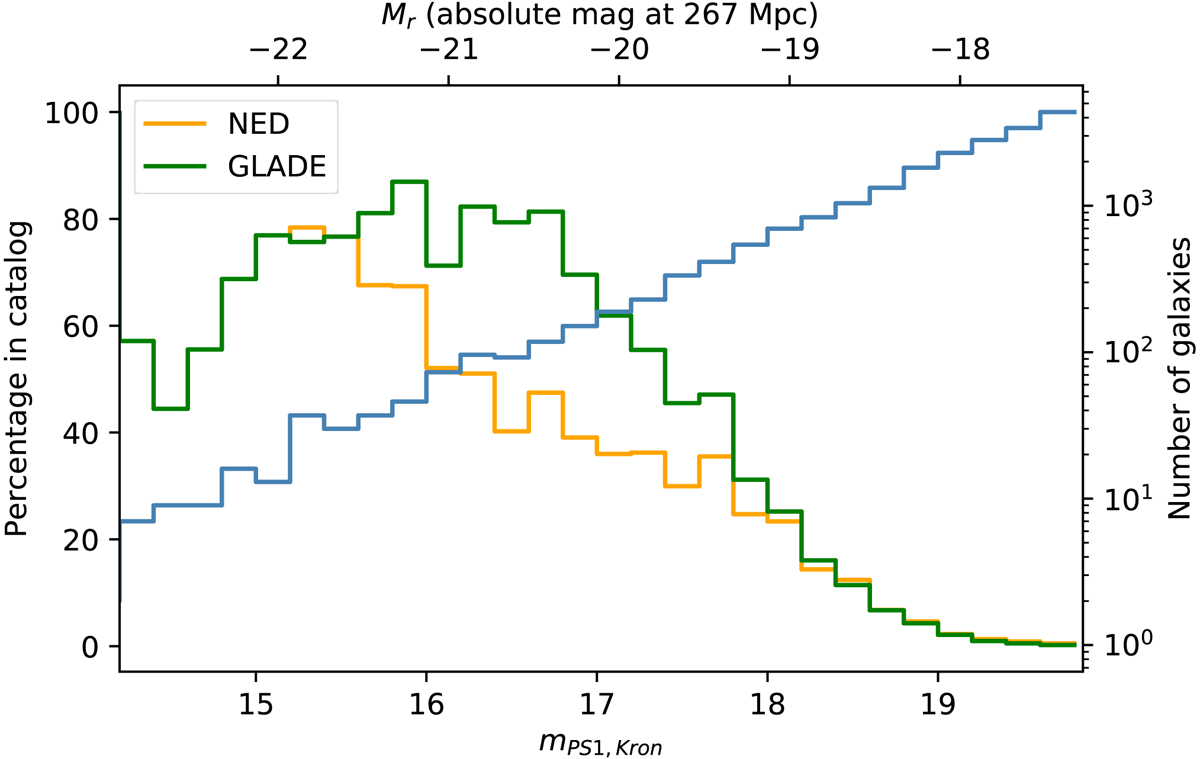
Orange and green lines, left axis: percentage of sources in the PS1 catalogue that have an associated NED and GLADE, respectively, cross-matched galaxy with spectroscopic redshift as a function of magnitude. Blue line, right axis: histogram of galaxy counts as a function of magnitude, from our Pan-STARRS-derived extended source catalogue.
Current usage metrics show cumulative count of Article Views (full-text article views including HTML views, PDF and ePub downloads, according to the available data) and Abstracts Views on Vision4Press platform.
Data correspond to usage on the plateform after 2015. The current usage metrics is available 48-96 hours after online publication and is updated daily on week days.
Initial download of the metrics may take a while.