Fig. 73.
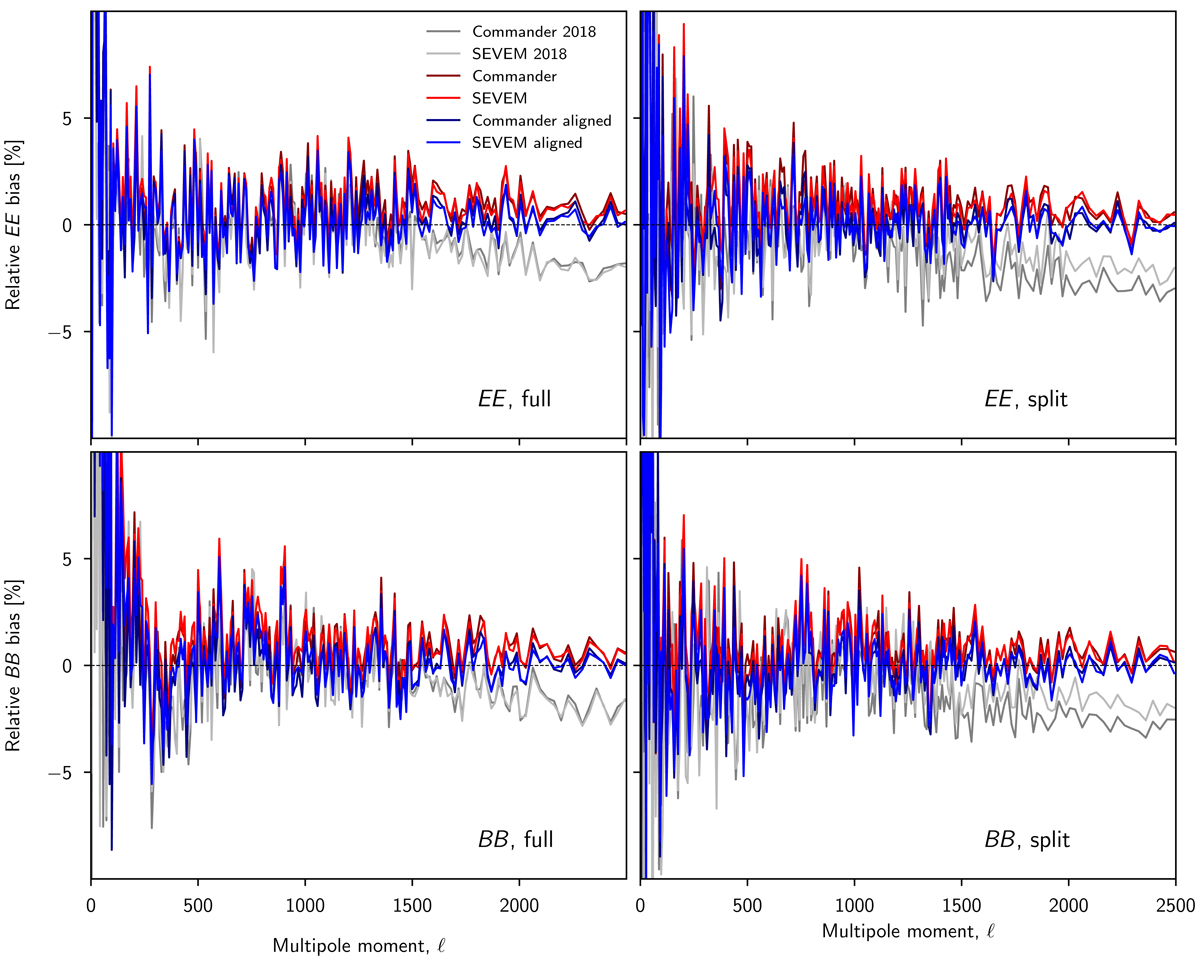
Power spectrum consistency between the foreground-cleaned Commander (dark curves) and SEVEM (light curves) CMB polarization map and corresponding end-to-end-simulations. Each panel shows the fractional difference between the angular power spectrum computed from the observed data and the mean of the simulations. Blue and red curves show results derived for NPIPE data using simulations with and without noise alignment, respectively, while grey curves show similar results derived from Planck 2018 data using simulations with noise alignment. Rows show results for EE (top) and BB (bottom) spectra, while columns show results for full-mission (left) and split (right) data. In the latter case, A-B split results are shown for NPIPE, while half-mission splits are shown for Planck 2018.
Current usage metrics show cumulative count of Article Views (full-text article views including HTML views, PDF and ePub downloads, according to the available data) and Abstracts Views on Vision4Press platform.
Data correspond to usage on the plateform after 2015. The current usage metrics is available 48-96 hours after online publication and is updated daily on week days.
Initial download of the metrics may take a while.