Fig. E.1.
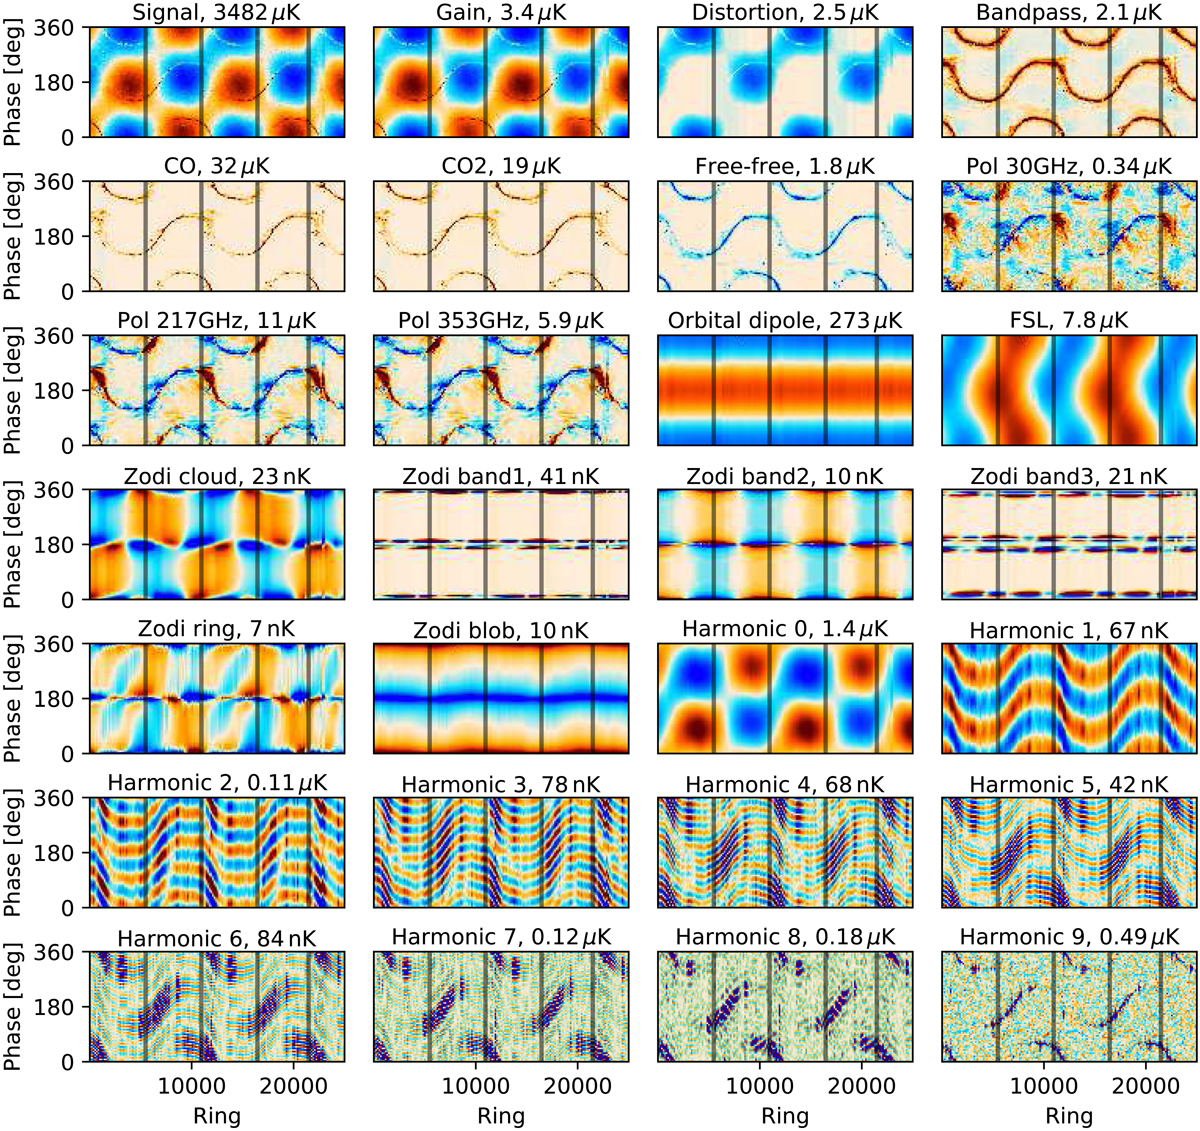
Signal and systematics templates for detector 100-1a, plotted as a function of pointing period (ring) and spacecraft spin phase. The gain and signal distortion templates are actually split into several disjoint steps that vary in length depending on the S/N. The templates for 100-1b are otherwise identical, but the 30, 217, and 353 GHz polarization templates are multiplied by −1. The far sidelobe (FSL) template is not fitted because of degeneracies, but it is estimated and subtracted. The polarization templates across all detectors share a single fitting amplitude. The zodiacal emission-template amplitudes are similarly shared. For 353 GHz and above, the harmonic templates are doubled to include frequency-dependent gain. At 100–217 GHz, only relative time-shift between frequency bins is modelled. The last harmonic template includes all frequencies not included in the other harmonic templates. The templates are scaled to match the rms amplitude of each systematic across the 100 GHz detectors, and the plotting ranges are chosen to match the 2 σ range of each panel. To save space, the amplitude is reported in the title of each panel rather than as a colour bar. The grey vertical lines indicate the survey boundaries. Figure E.2 shows HEALPix maps of these templates that include only the first survey.
Current usage metrics show cumulative count of Article Views (full-text article views including HTML views, PDF and ePub downloads, according to the available data) and Abstracts Views on Vision4Press platform.
Data correspond to usage on the plateform after 2015. The current usage metrics is available 48-96 hours after online publication and is updated daily on week days.
Initial download of the metrics may take a while.