Fig. 1.
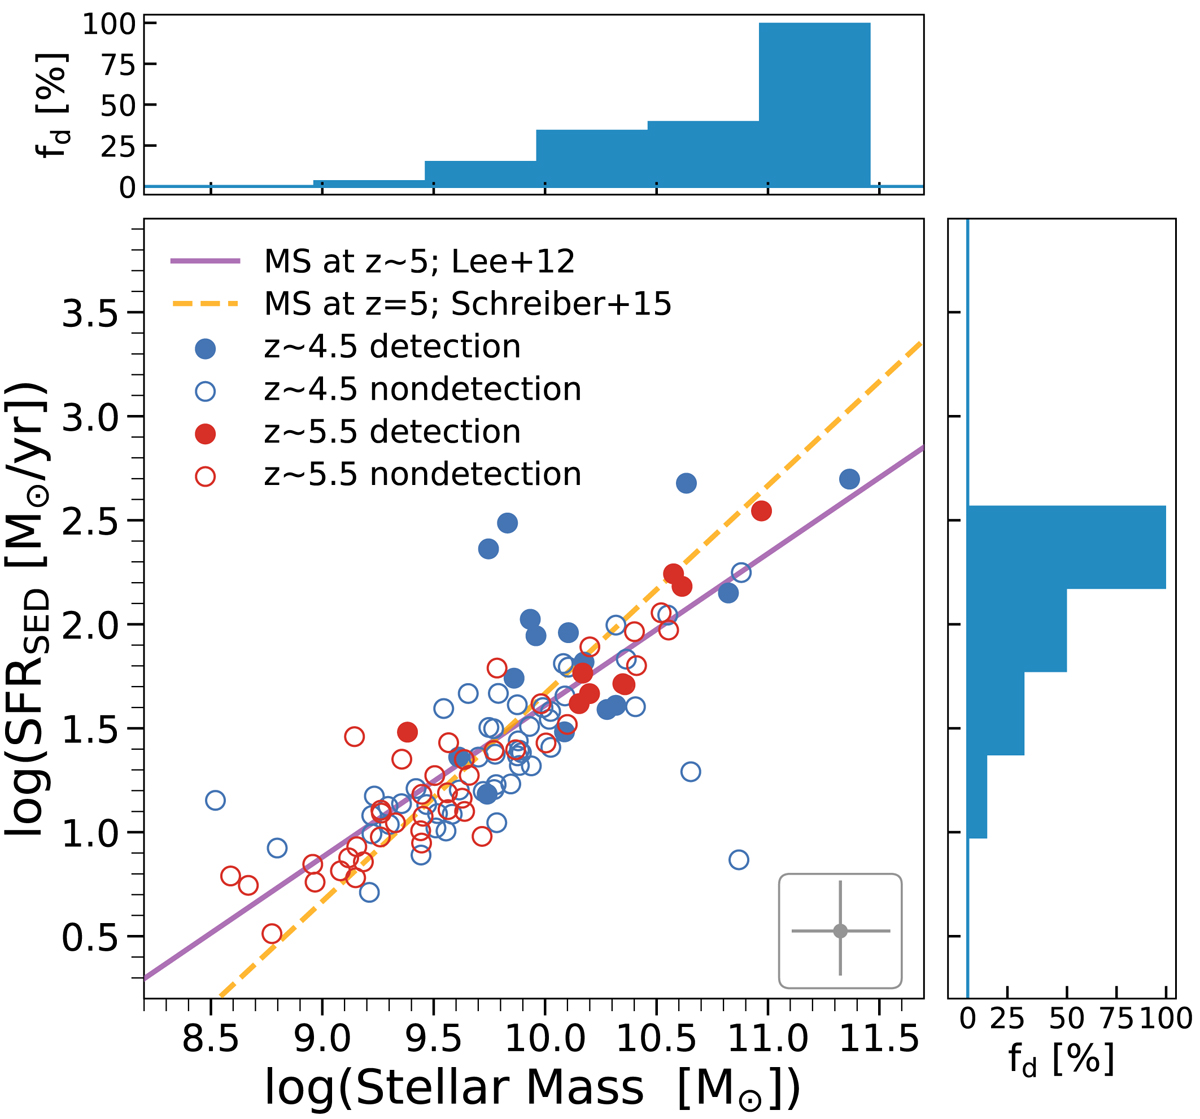
Stellar mass and SFR diagram of our galaxies estimated using the SED fitting code LePhare (Ilbert et al. 2006; Arnouts et al. 1999). Top and right panels: detection rates (fd) of continuum emission as functions of SFR and stellar mass. Filled and open points in the middle panel represent the continuum detected (> 3.5σ) and the non-detected galaxies (blue: z ∼ 4.5, red: z ∼ 5.5 galaxies), respectively. Solid and dashed lines show two different estimates of the z ∼ 5 main-sequence of star forming galaxies (Lee et al. 2012; Schreiber et al. 2015). Typical uncertainty of SFR and stellar mass are shown in the bottom right inset. The continuum detected galaxies mostly show stellar mass above ∼1010 M⊙, and SFR above ∼30 M⊙ yr−1.
Current usage metrics show cumulative count of Article Views (full-text article views including HTML views, PDF and ePub downloads, according to the available data) and Abstracts Views on Vision4Press platform.
Data correspond to usage on the plateform after 2015. The current usage metrics is available 48-96 hours after online publication and is updated daily on week days.
Initial download of the metrics may take a while.