Fig. 5.
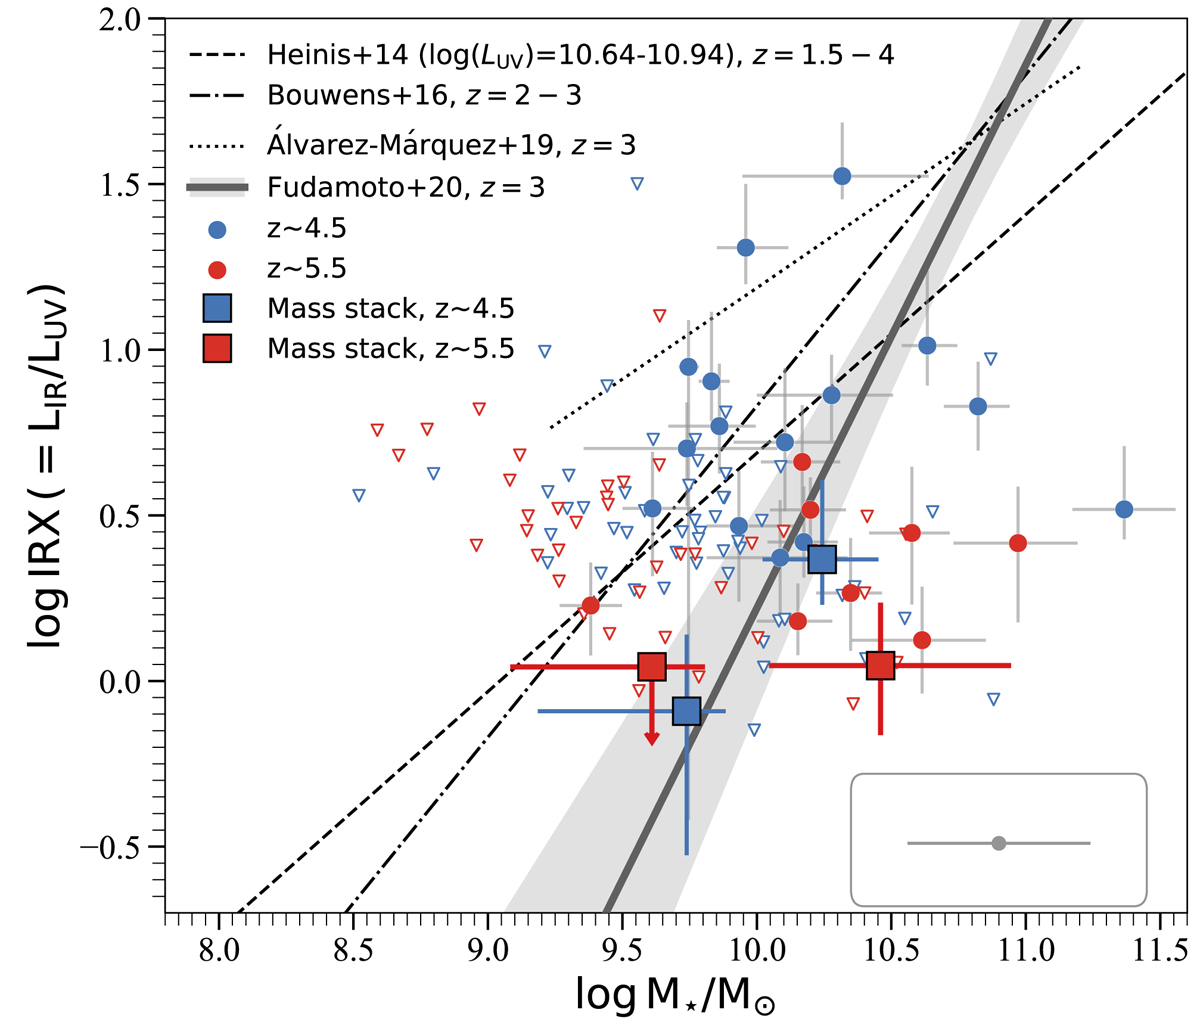
IRX–M⋆ diagram of our galaxies compared to previously determined relations at different redshifts. Blue and red points show individual FIR continuum detections at 4 < z < 5 and at 5 < z < 6, respectively. Open downward triangles show 3σ upper limits of individual IR nondetections. Stacks are shown rectangles (blue at z ∼ 4.5, red for z ∼ 5.5). The nondetection of the stack is indicated by a downward arrow. The inset shows the median uncertainty of individual M⋆ estimations (log (ΔM⋆/M⊙) = ± 0.34). Lines show IRX–M⋆ relations derived in previous studies at z ∼ 2 − 4 (Álvarez-Márquez et al. 2016; Bouwens et al. 2016; Koprowski et al. 2018; Fudamoto et al. 2020). The gray band shows the 1σ uncertainty of the Fudamoto et al. (2020) relation. With the exception of the high mass bin at z ∼ 5.5, the population average stacked IRX values are consistent with this relation. However, the intrinsic dispersion from galaxy to galaxy at fixed stellar mass is clearly extremely large.
Current usage metrics show cumulative count of Article Views (full-text article views including HTML views, PDF and ePub downloads, according to the available data) and Abstracts Views on Vision4Press platform.
Data correspond to usage on the plateform after 2015. The current usage metrics is available 48-96 hours after online publication and is updated daily on week days.
Initial download of the metrics may take a while.