Fig. 6.
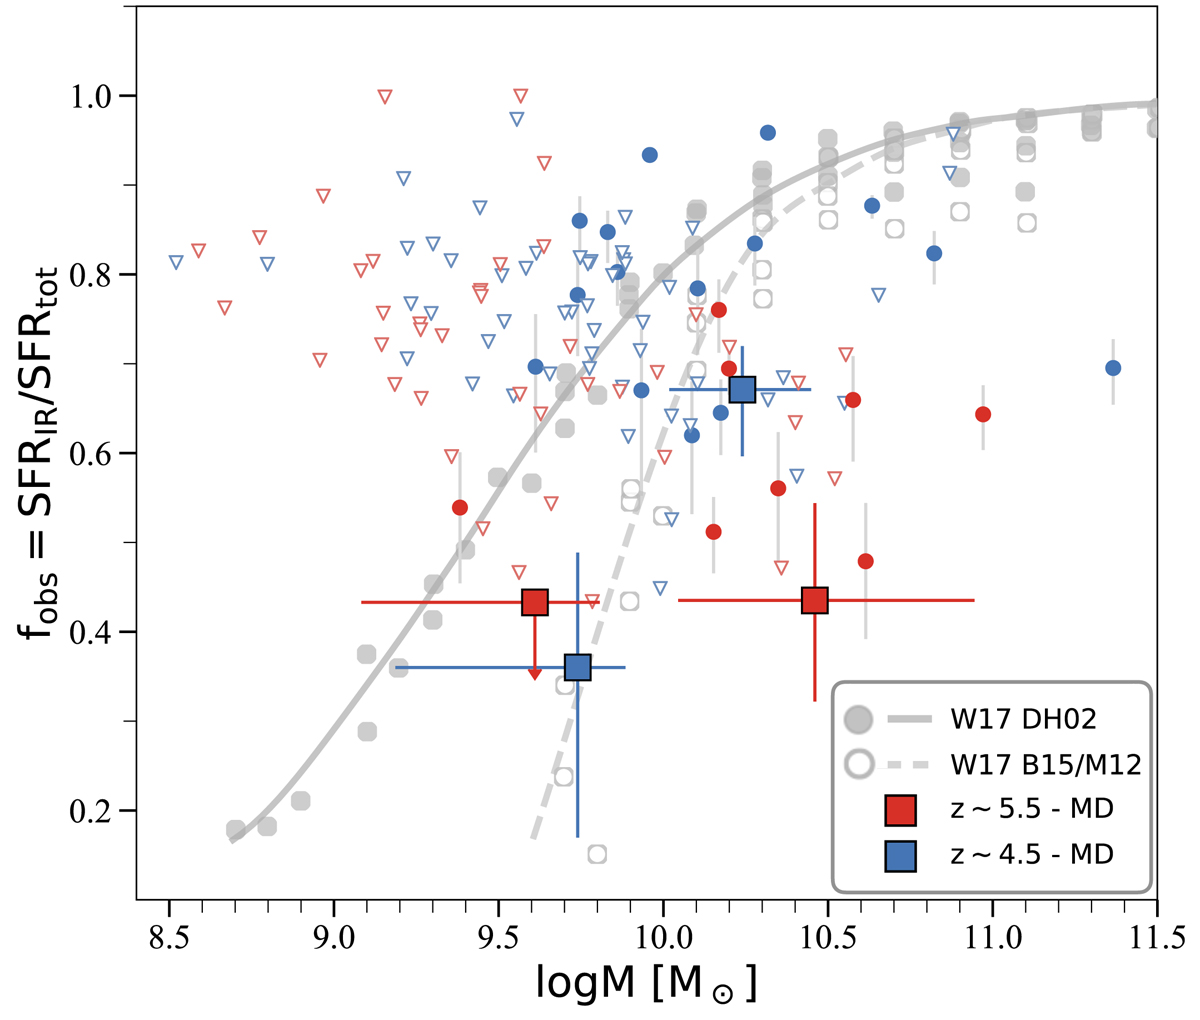
Obscured fraction of star formation as a function of stellar mass (fobs − M⋆ relation) of our UV selected sample. Blue and red points show individual FIR continuum detections at 4 < z < 5 and at 5 < z < 6, respectively. Triangles show 3σ upper limits for IR nondetections. Stacks are shown by blue (at z ∼ 4.5) and by red (at z ∼ 5.5) rectangles. The nondetection of the stack is indicated by a downward arrow. Gray points and lines show the observed relation at redshifts between z = 0 and z ∼ 2.5 (Whitaker et al. 2017). The solid line shows the constant fobs − M⋆ relation of z ∼ 2.5 to z ∼ 0 using a template from Dale & Helou (2002), and the dashed line shows the same using Béthermin et al. (2015) or Magdis et al. (2012) templates. At M⋆ < 1010 M⊙, our z ∼ 4.5 stacks are potentially consistent with the fobs at z ∼ 2.5 to z ∼ 0 using Béthermin et al. (2015) or Magdis et al. (2012) templates. However, at M⋆ > 1010 M⊙, our stacks show decreasing fobs from z ∼ 2.5 to z ∼ 5.5, suggesting a rapid evolution of dust obscured star formation activity in main-sequence galaxies at z > 4. However, we caution that UV-selected samples at z > 4 may be incomplete at very high masses (M⋆ > 1010.5 M⊙) given the absence of deep rest-frame optical imaging, as as been shown recently by the detection of a significant population of UV-undetected, massive galaxies (e.g., Wang et al. 2019; Alcalde Pampliega et al. 2019).
Current usage metrics show cumulative count of Article Views (full-text article views including HTML views, PDF and ePub downloads, according to the available data) and Abstracts Views on Vision4Press platform.
Data correspond to usage on the plateform after 2015. The current usage metrics is available 48-96 hours after online publication and is updated daily on week days.
Initial download of the metrics may take a while.