Fig. 11.
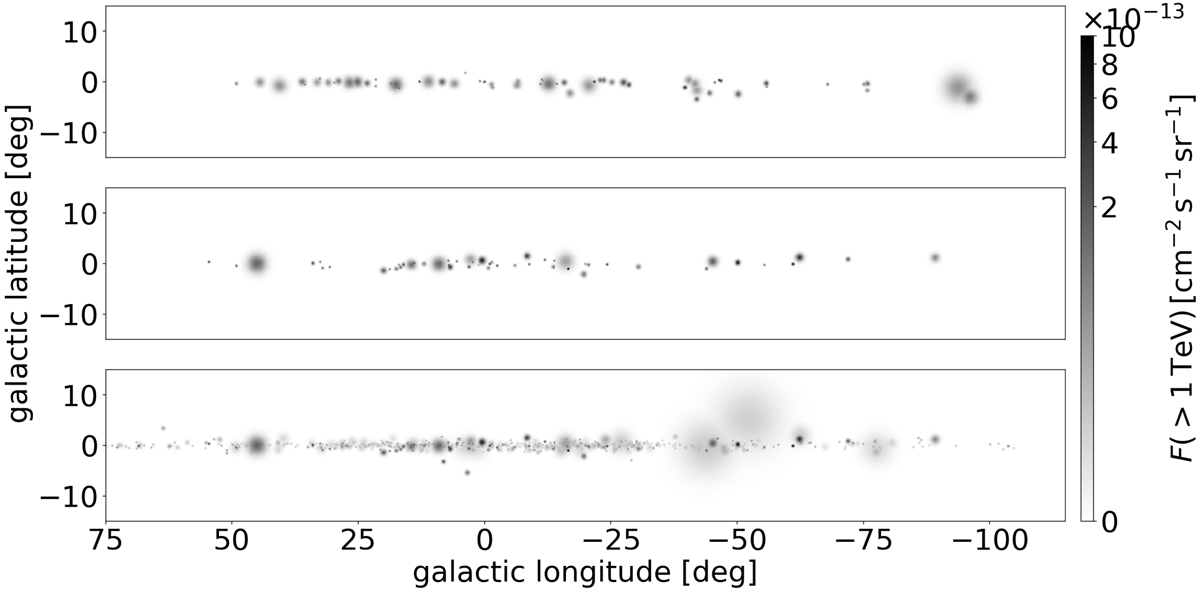
Sky maps of the VHE source population in the HGPS region. Top: from the HGPS catalogue. This map has been constructed by assuming a spherical source shape for better comparability with the simulations. Middle: detectable sources from the synthetic population shown in Fig. 10, based on the mSp4 model. Bottom: all sources from this simulated realisation.
Current usage metrics show cumulative count of Article Views (full-text article views including HTML views, PDF and ePub downloads, according to the available data) and Abstracts Views on Vision4Press platform.
Data correspond to usage on the plateform after 2015. The current usage metrics is available 48-96 hours after online publication and is updated daily on week days.
Initial download of the metrics may take a while.