Fig. 5.
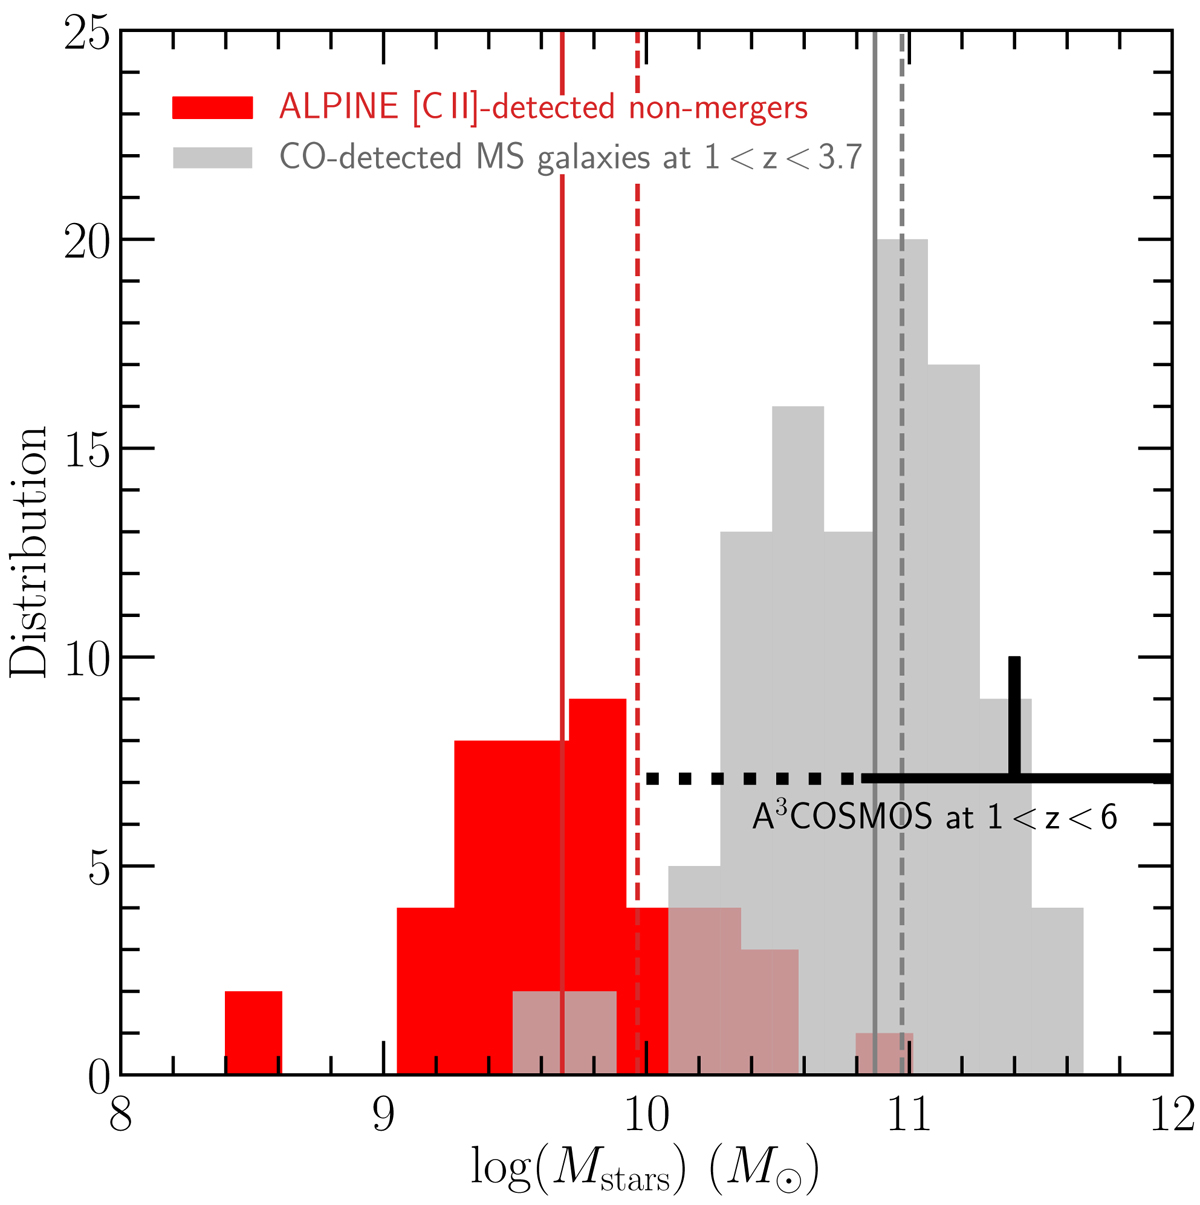
Distribution of stellar masses of the 44 ALPINE [C II]-detected nonmerger galaxies at z = 4.4 − 5.9 (red histogram) and the comparison sample of 101 CO-detected MS SFGs at 1 < z < 3.7 compiled from the literature (gray histogram). The solid and dashed lines correspond, respectively, to the medians and means of the two distributions. The black thick lines show the range and the mean of Mstars of the A3COSMOS galaxies at 1 < z < 6 (Liu et al. 2019b). Clearly, the ALPINE sample probes a much lower Mstars range than previous galaxy samples with molecular gas mass measurements obtained mostly at lower redshift.
Current usage metrics show cumulative count of Article Views (full-text article views including HTML views, PDF and ePub downloads, according to the available data) and Abstracts Views on Vision4Press platform.
Data correspond to usage on the plateform after 2015. The current usage metrics is available 48-96 hours after online publication and is updated daily on week days.
Initial download of the metrics may take a while.