Fig. 6.
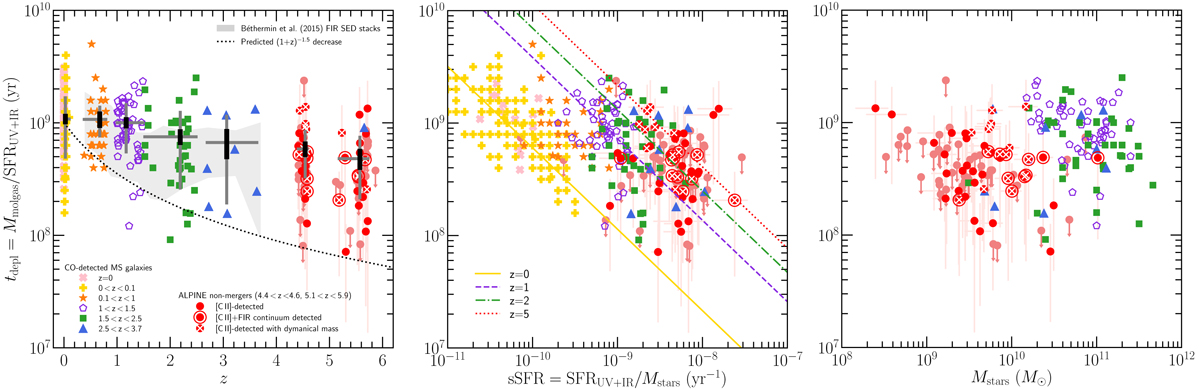
Molecular gas depletion timescales plotted for the ALPINE nonmerger galaxies distributed in two redshift bins of 4.4 < z < 4.6 and 5.1 < z < 5.9 (red circles; encircled red circles mark the ALPINE galaxies detected in FIR dust continuum; crossed red circles mark the ALPINE galaxies with dynamical mass measurements; and light-red arrows correspond to 3σ upper limits) and for our compilation of CO-detected MS SFGs from the literature color-coded in six redshift bins of z = 0 (pink crosses), 0 < z < 0.1 (yellow pluses), 0.1 < z < 1 (orange stars), 1 < z < 1.5 (violet open pentagons), 1.5 < z < 2.5 (green squares), and 2.5 < z < 3.7 (blue triangles, plus the Pavesi et al. 2019 object at z = 5.65). Left panel: molecular gas depletion timescales shown as a function of redshift. The respective means, errors on the means, and standard deviations per redshift bin are indicated by the large black/gray crosses. The light-gray shaded area corresponds to the depletion timescales obtained by Béthermin et al. (2015) from FIR SED stacks. The tdepl means per redshift bin follow a decrease out to z ∼ 6, but much shallower than the (1 + z)−1.5 decline predicted in the framework of the bathtub model (dotted line). Middle panel: molecular depletion timescales shown as a function of specific star formation rate. A strong anti-correlation between tdepl and sSFR is observed at z = 0 (yellow solid line from Saintonge et al. 2011) and at high redshift. The displacement along the sSFR-axis for galaxies at higher redshift is compatible with the sSFR evolution with redshift (violet dashed line at z = 1, green dashed-dotted line at z = 2, and red dotted line at z = 5, as computed using the sSFR(z) parametrization from Speagle et al. 2014, Eq. (28)). Right panel: molecular depletion timescales restricted to z = 1 − 5.9 SFGs and shown as a function of stellar mass. No correlation between tdepl and Mstars is observed.
Current usage metrics show cumulative count of Article Views (full-text article views including HTML views, PDF and ePub downloads, according to the available data) and Abstracts Views on Vision4Press platform.
Data correspond to usage on the plateform after 2015. The current usage metrics is available 48-96 hours after online publication and is updated daily on week days.
Initial download of the metrics may take a while.