Fig. 7.

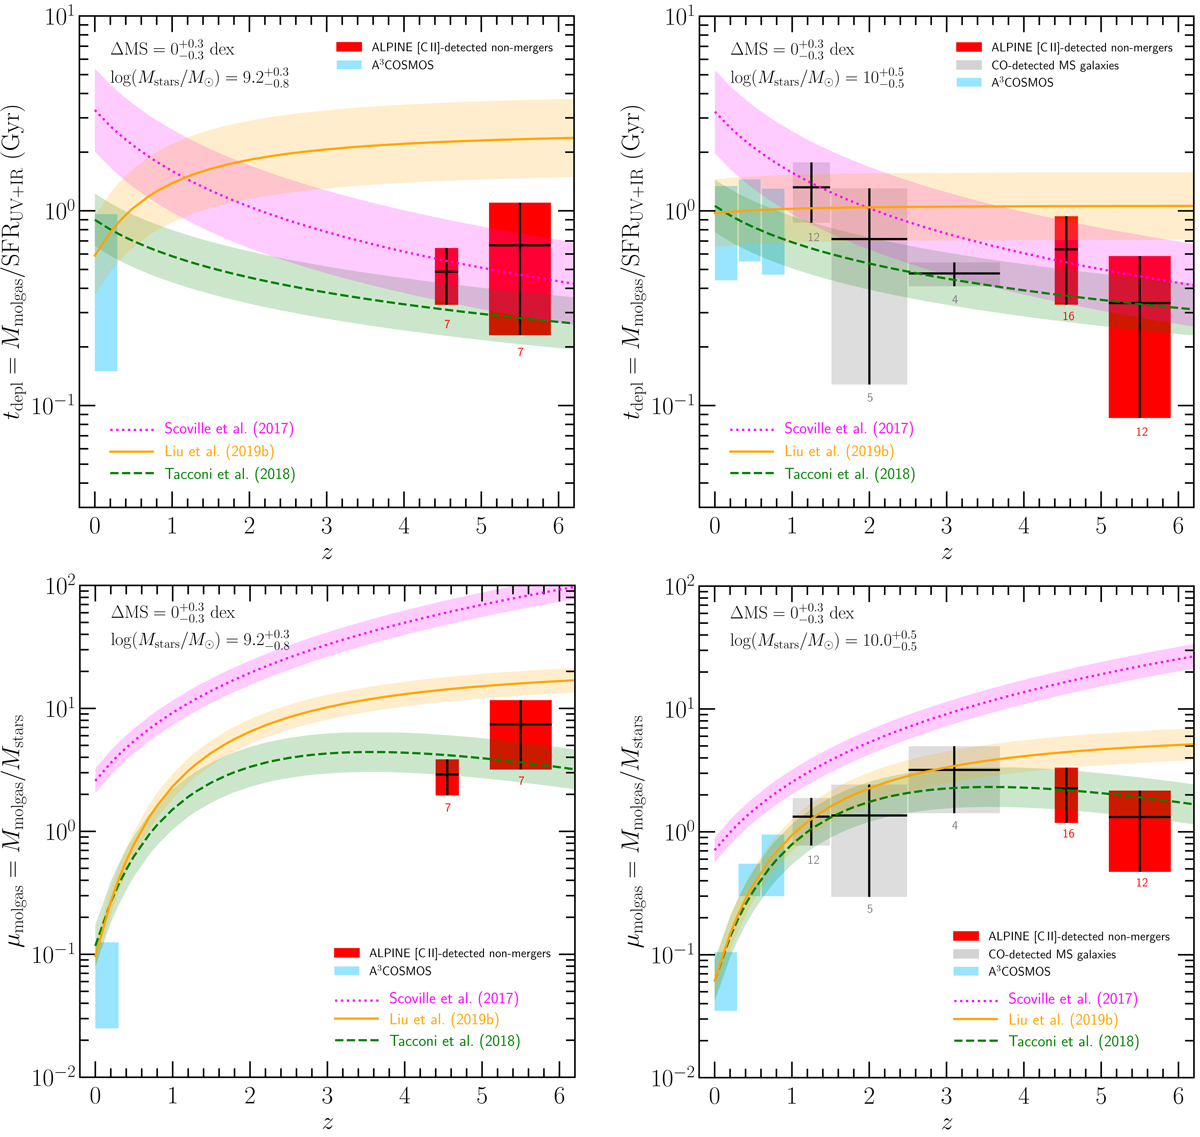
Redshift evolution of the molecular gas depletion timescale (top panels) and the molecular gas mass to stellar mass ratio (bottom panels) of MS galaxies (![]() dex) in two stellar mass bins of log(Mstars/M⊙) = 8.4 − 9.5 (left panels) and log(Mstars/M⊙) = 9.5 − 10.5 (right panels). The red boxes show the respective tdepl and μmolgas means ±1σ dispersion of the ALPINE [C II]-detected nonmerger galaxies in redshift bins of 4.4 < z < 4.6 and 5.1 < z < 5.9. The gray boxes represent the CO-detected galaxies from our compilation in redshift bins of 1 < z < 1.5, 1.5 < z < 2.5, and 2.5 < z < 3.7, and the blue boxes the A3COSMOS galaxies at 0 < z < 1 in Δz = 0.3 bins. The number drawn below boxes gives the number of galaxies used to derive the mean and 1σ dispersion. For comparison, we show with violet dotted, orange solid, and green dashed lines the multi-functional tdepl and μmolgas best-fit functions of, respectively, Scoville et al. (2017), Liu et al. (2019b), and Tacconi et al. (2018), calculated for ΔMS = 0 dex (the shaded areas define the ΔMS = ±0.3 dex range) and for fixed stellar masses of log(Mstars/M⊙) = 9.2 (left panels) and log(Mstars/M⊙) = 10 (right panels).
dex) in two stellar mass bins of log(Mstars/M⊙) = 8.4 − 9.5 (left panels) and log(Mstars/M⊙) = 9.5 − 10.5 (right panels). The red boxes show the respective tdepl and μmolgas means ±1σ dispersion of the ALPINE [C II]-detected nonmerger galaxies in redshift bins of 4.4 < z < 4.6 and 5.1 < z < 5.9. The gray boxes represent the CO-detected galaxies from our compilation in redshift bins of 1 < z < 1.5, 1.5 < z < 2.5, and 2.5 < z < 3.7, and the blue boxes the A3COSMOS galaxies at 0 < z < 1 in Δz = 0.3 bins. The number drawn below boxes gives the number of galaxies used to derive the mean and 1σ dispersion. For comparison, we show with violet dotted, orange solid, and green dashed lines the multi-functional tdepl and μmolgas best-fit functions of, respectively, Scoville et al. (2017), Liu et al. (2019b), and Tacconi et al. (2018), calculated for ΔMS = 0 dex (the shaded areas define the ΔMS = ±0.3 dex range) and for fixed stellar masses of log(Mstars/M⊙) = 9.2 (left panels) and log(Mstars/M⊙) = 10 (right panels).
Current usage metrics show cumulative count of Article Views (full-text article views including HTML views, PDF and ePub downloads, according to the available data) and Abstracts Views on Vision4Press platform.
Data correspond to usage on the plateform after 2015. The current usage metrics is available 48-96 hours after online publication and is updated daily on week days.
Initial download of the metrics may take a while.


