Fig. 8.
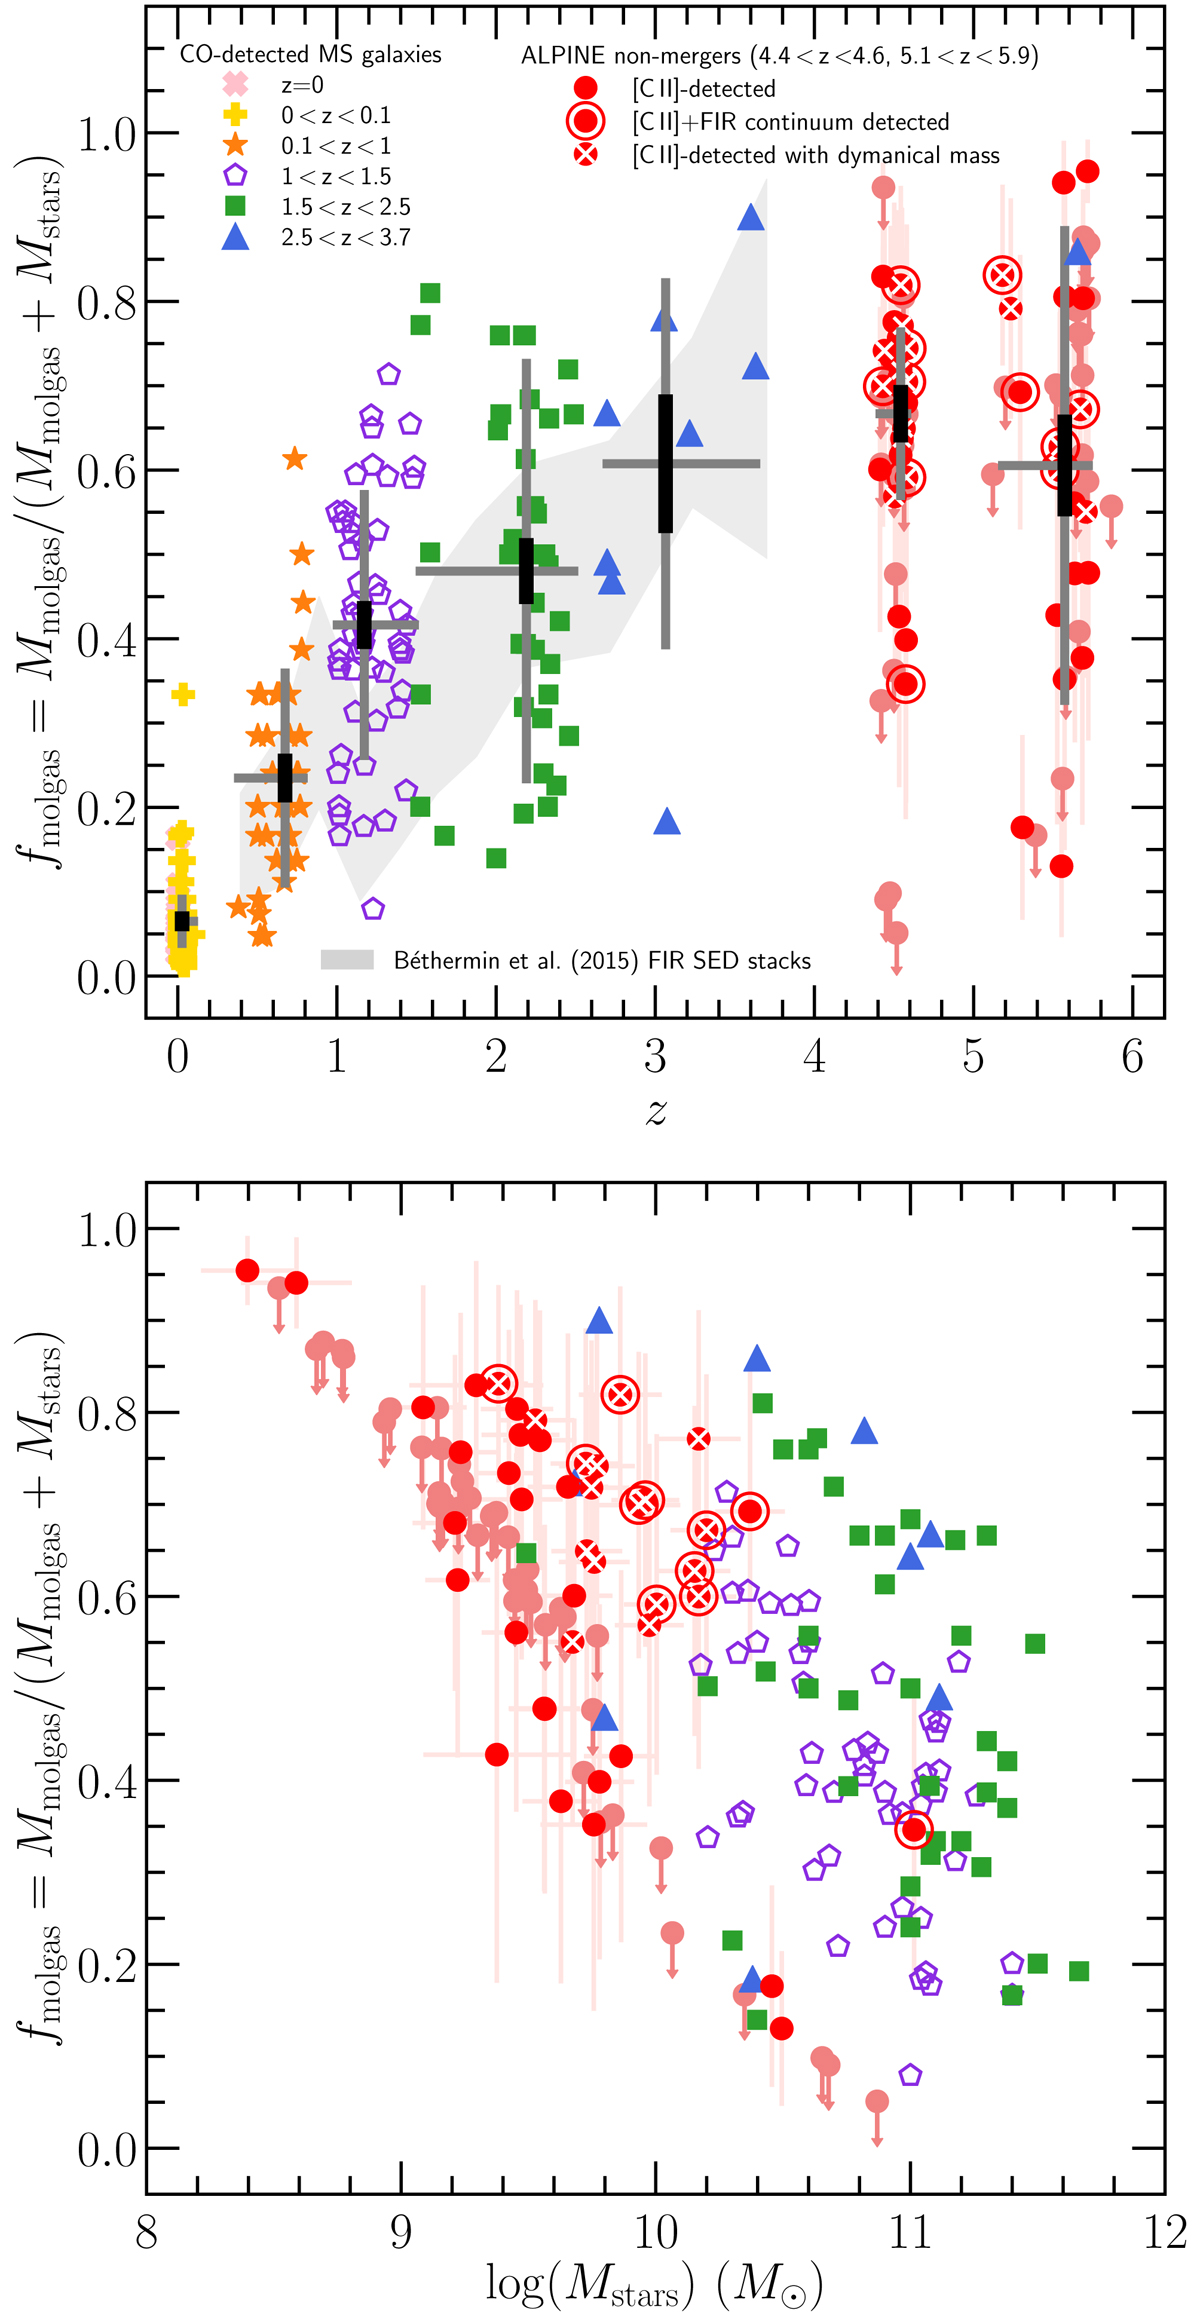
Molecular gas fractions plotted for the same ALPINE galaxies (red circles) and CO-detected MS SFGs with the same color coding per redshift bin as in Fig. 6. Top panel: molecular gas fractions shown as a function of redshift. The respective means, errors on the means, and standard deviations per redshift bin are indicated by the large black/gray crosses. The light-gray shaded area corresponds to the molecular gas fractions obtained by Béthermin et al. (2015) from FIR SED stacks. The fmolgas means per redshift bin show a steep increase from z = 0 to z ∼ 3.7, followed by a flattening toward higher redshift within the 1σ dispersion on the means. Bottom panel: molecular gas fractions restricted to z ∼ 1 − 5.9 SFGs and shown as a function of stellar mass. A strong dependence of fmolgas on Mstars is observed for CO-detected high-redshift galaxies and the ALPINE galaxies as well.
Current usage metrics show cumulative count of Article Views (full-text article views including HTML views, PDF and ePub downloads, according to the available data) and Abstracts Views on Vision4Press platform.
Data correspond to usage on the plateform after 2015. The current usage metrics is available 48-96 hours after online publication and is updated daily on week days.
Initial download of the metrics may take a while.