Fig. 4.
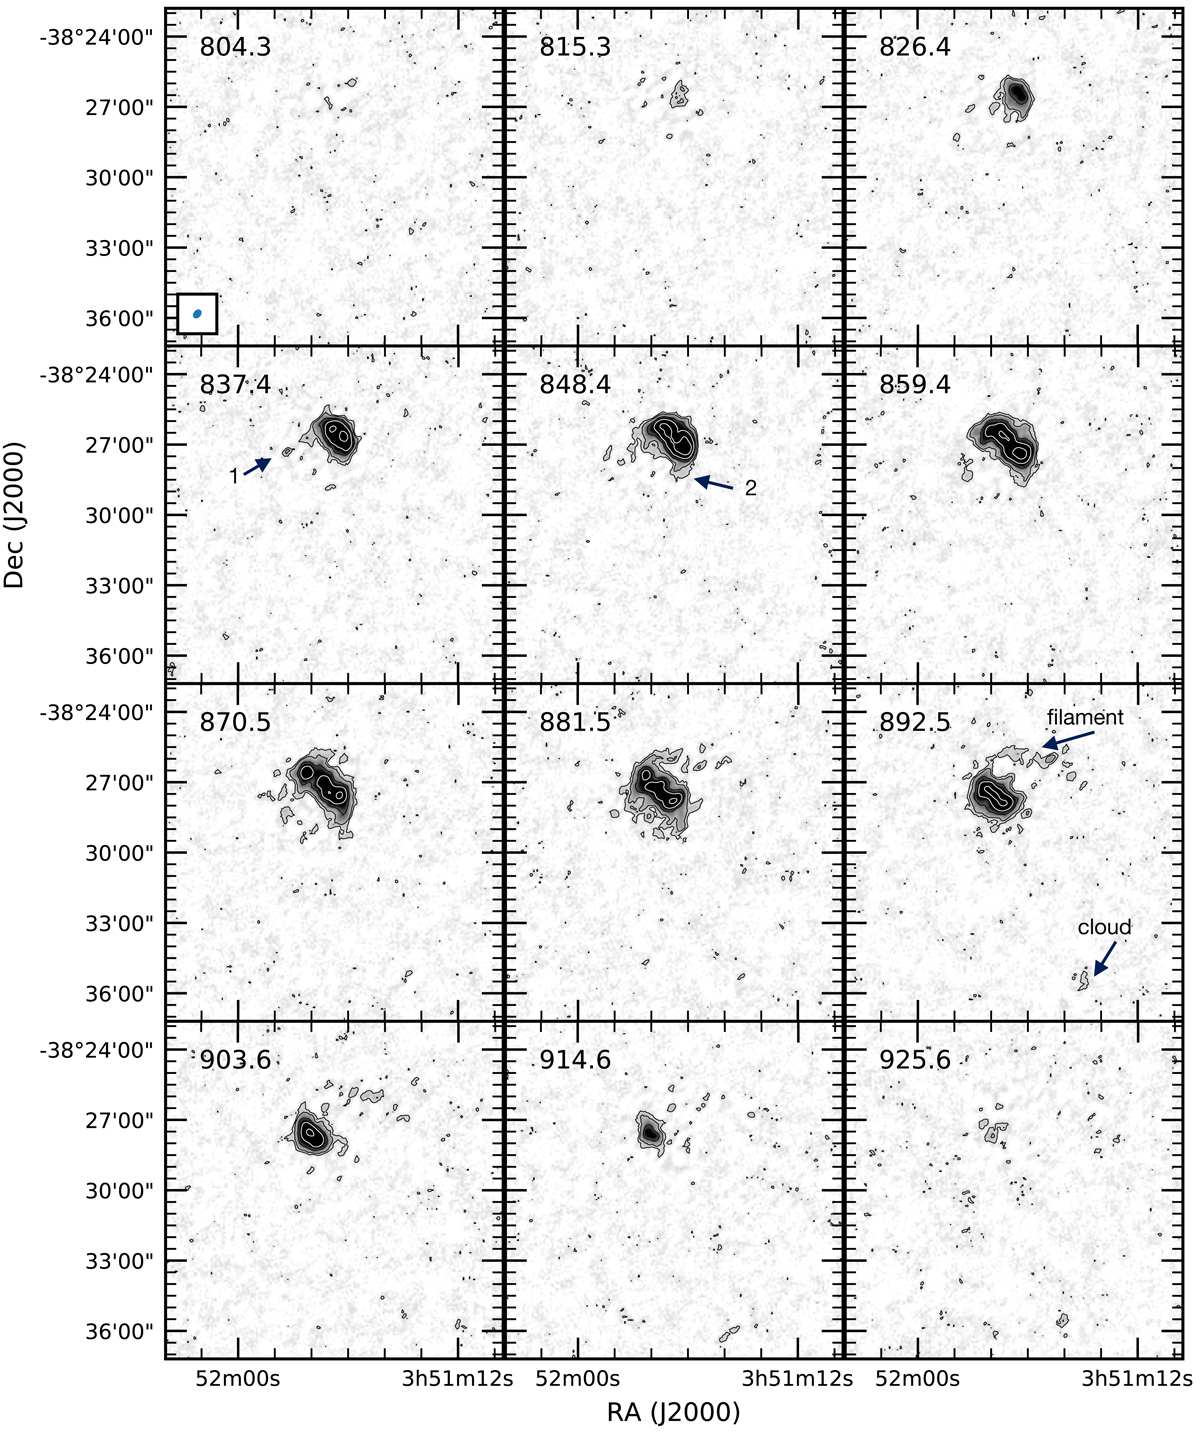
Channel maps of the 32k data containing H I emission produced using r = 1.0. Only every second channel is shown. The velocity of each channel is given in the top left in km s−1. The beam (as given in Table 2) is indicated in the box in the top-left panel. The contour levels are drawn at (2.5, 5.0, 12.5)σ for the black contours, and at (25, 50)σ for the white contours. The noise σ equals 255 μJy beam−1. The cloud and filament are indicated. Numbers “1” and “2” refer to features described in the text.
Current usage metrics show cumulative count of Article Views (full-text article views including HTML views, PDF and ePub downloads, according to the available data) and Abstracts Views on Vision4Press platform.
Data correspond to usage on the plateform after 2015. The current usage metrics is available 48-96 hours after online publication and is updated daily on week days.
Initial download of the metrics may take a while.