Fig. 5.
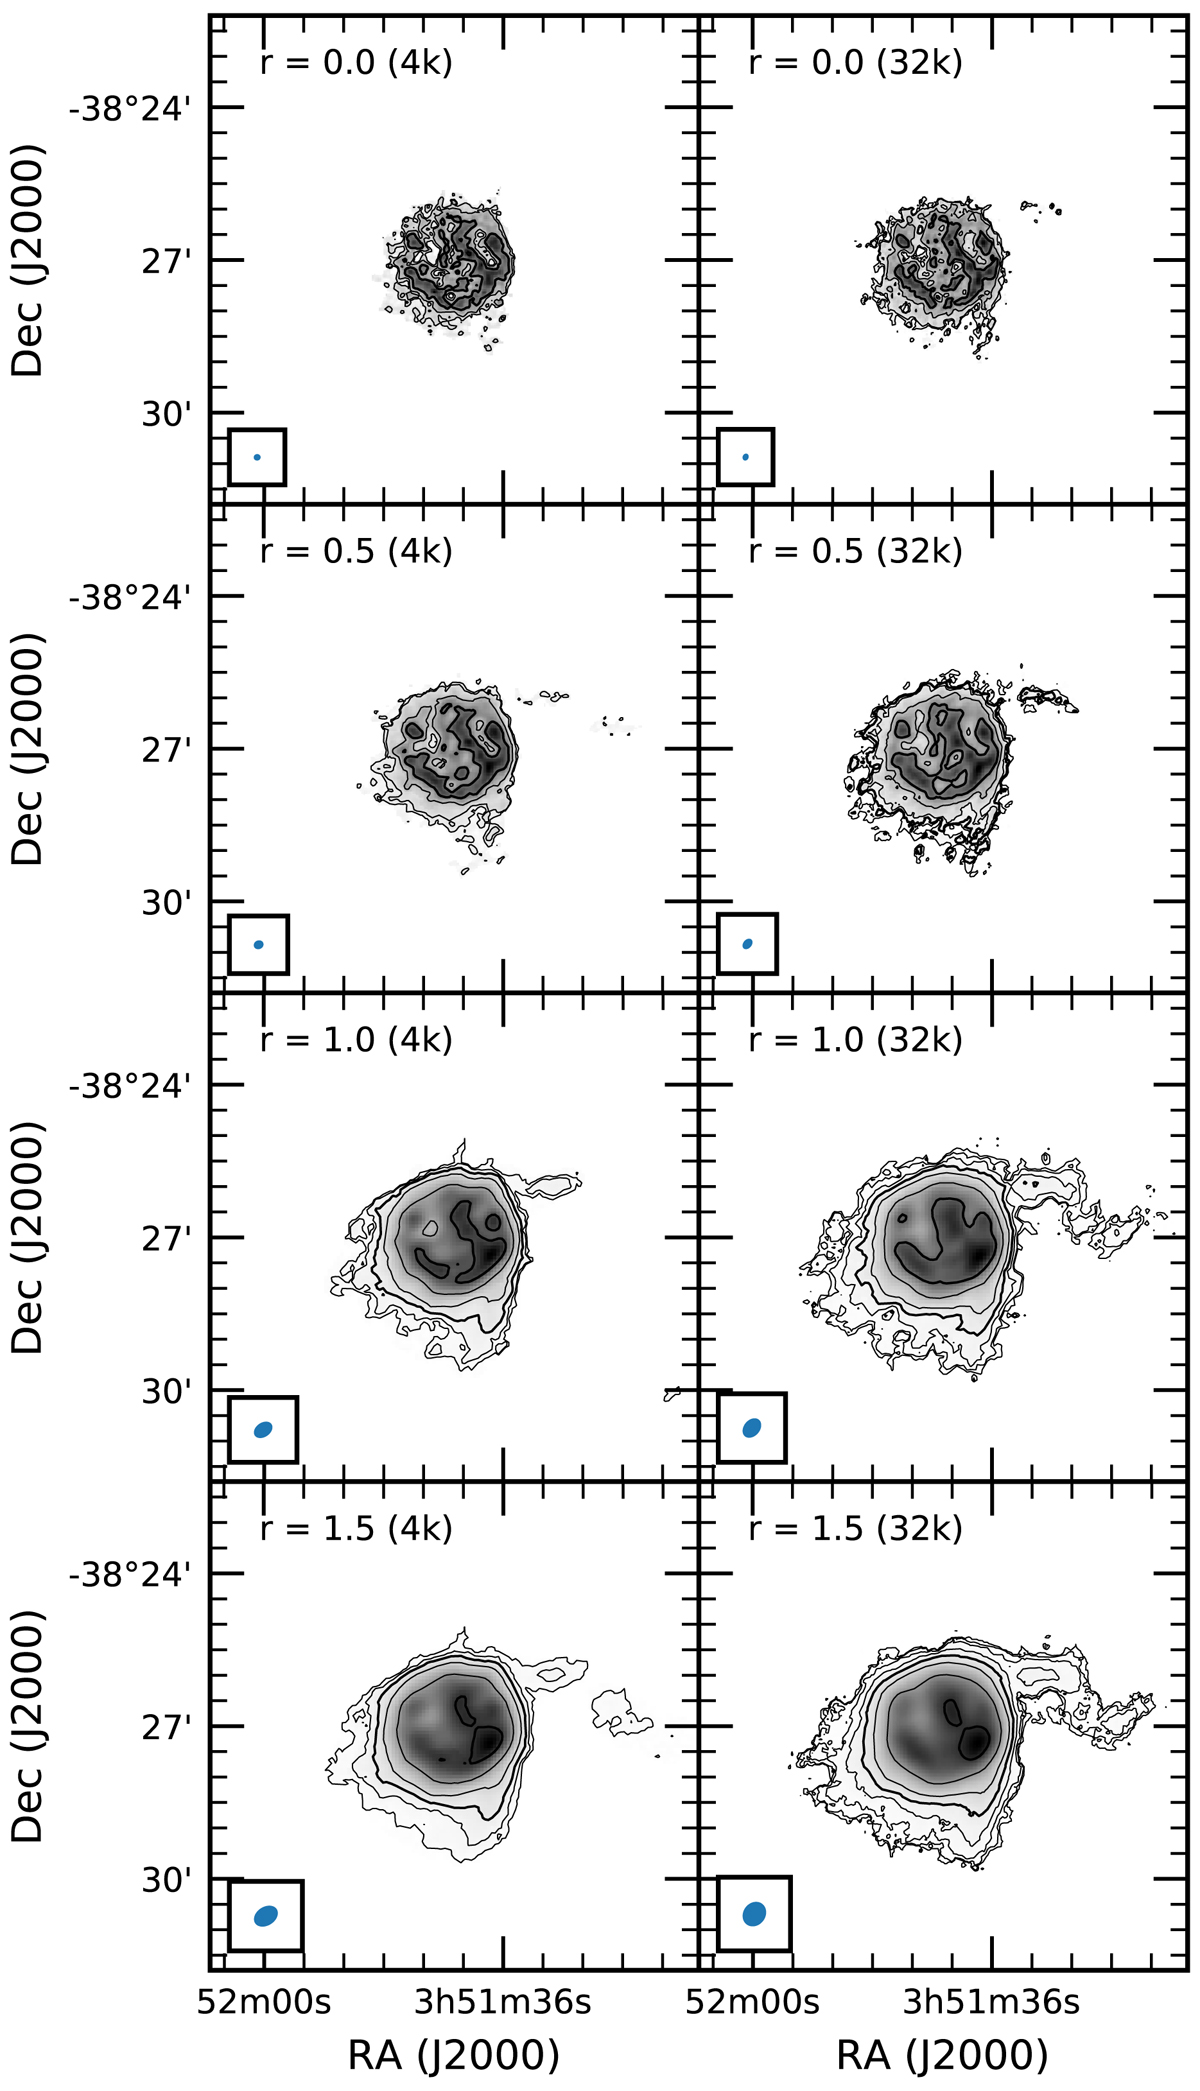
Integrated MeerKAT H I (zeroth moment) maps of the galaxy ESO 302-G014 produced using different robust values. Rows show data imaged with different robust factors, given in the top-left of each panel, with values from top to bottomr = 0.0, 0.5, 1.0, 1.5. Columns show the two data sets, with the 4k data on the left and the 32k data on the right. The respective beams are indicated in the box in the lower-left corners of the panels, and are also listed in Table 2. The lowest contour levels shown are always the 3σ contour levels, with σ given in Table 2, followed by contours at fixed approximately logarithmically-spaced column density levels. This results in the following contour values (in units of 1020 cm−2): left column (4k data), from top to bottom: r = 0.0: (2.9, 5.0, 10.0); r = 0.5: (1.2, 2.0, 5.0, 10.0); r = 1.0: (0.3, 0.5, 1.0, 2.0, 5.0, 10.0); r = 1.5: (0.2, 0.5, 1.0, 2.0, 5.0, 10.0). Right column: (32k data), from top to bottom: r = 0.0: (1.2, 2.0, 5.0, 10.0); r = 0.5: (0.4, 1.0, 2.0, 5.0, 10.0); r = 1.0: (0.1, 0.2, 0.5, 1.0, 2.0, 5.0, 10.0); r = 1.5: (0.06, 0.1, 0.2, 0.5, 1.0, 2.0, 5.0, 10.0). The 1020 cm−2 and 1021 cm−2 contours are drawn with slightly thicker lines.
Current usage metrics show cumulative count of Article Views (full-text article views including HTML views, PDF and ePub downloads, according to the available data) and Abstracts Views on Vision4Press platform.
Data correspond to usage on the plateform after 2015. The current usage metrics is available 48-96 hours after online publication and is updated daily on week days.
Initial download of the metrics may take a while.