Fig. 8.
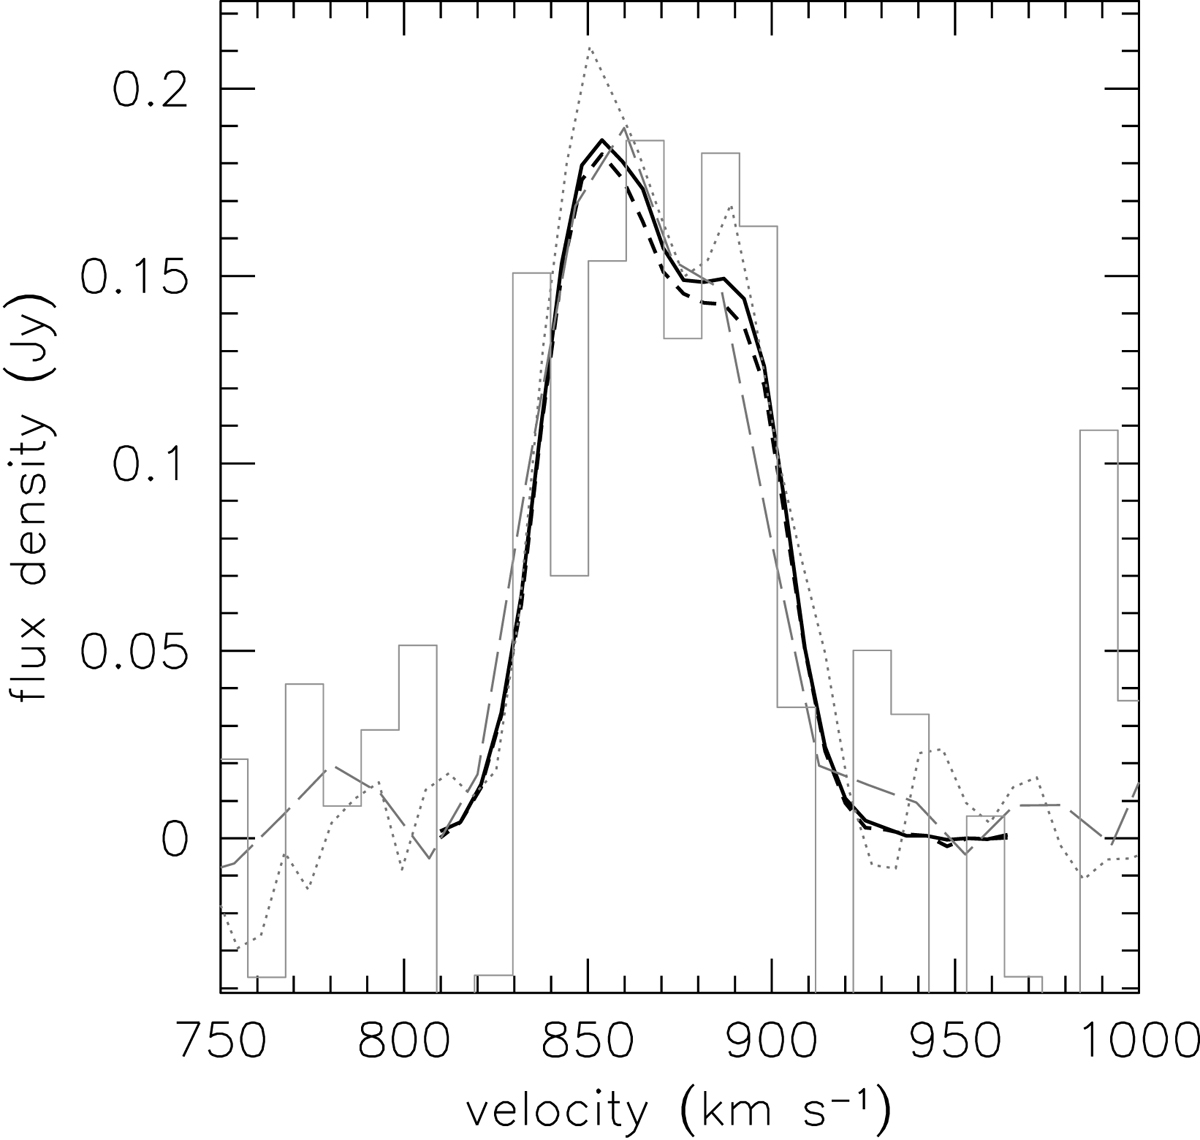
Integrated H I and CO spectra (global profiles). The full curve shows the r = 1.5 H I profile, the dashed curve the r = 0.5 profile from MeerKAT. The dotted gray line is the H I global profile derived from GBT data (Sardone et al., in prep.). The long-dashed gray line is the HIPASS spectrum. The histogram indicates the global ALMA CO spectrum where the CO flux density values have been scaled down by a factor of three.
Current usage metrics show cumulative count of Article Views (full-text article views including HTML views, PDF and ePub downloads, according to the available data) and Abstracts Views on Vision4Press platform.
Data correspond to usage on the plateform after 2015. The current usage metrics is available 48-96 hours after online publication and is updated daily on week days.
Initial download of the metrics may take a while.