Fig. 9.
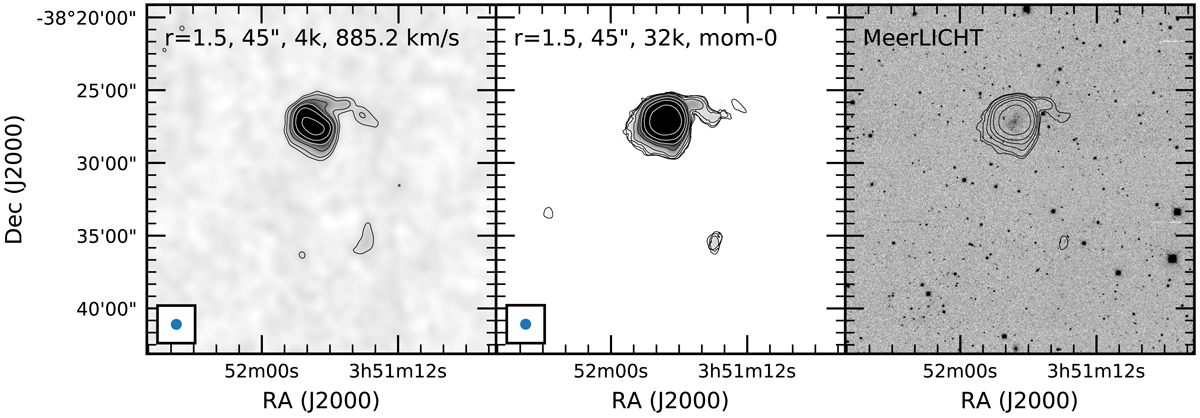
Lower resolution 45″ maps based on the r = 1.5 data. Left panel: 4k data channel map at 885.2 km s−1. Contour levels are (0.1, 0.2, 0.5, 1.0, 2.0, 5.0) × 1020 cm−2. Middle panel: 32k data integrated H I (zeroth moment) map. Contour levels are (0.03 (3σ), 0.05, 0.1, 0.2, 0.5, 1.0, 2.0, 5.0) × 1020 cm−2. Right panel: MeerLICHT q-band optical image, with 32k integrated H I map as overlay. Contour levels are (0.1, 0.2, 0.5, 1.0, 2.0, 5.0) × 1020 cm−2.
Current usage metrics show cumulative count of Article Views (full-text article views including HTML views, PDF and ePub downloads, according to the available data) and Abstracts Views on Vision4Press platform.
Data correspond to usage on the plateform after 2015. The current usage metrics is available 48-96 hours after online publication and is updated daily on week days.
Initial download of the metrics may take a while.