Fig. 8.
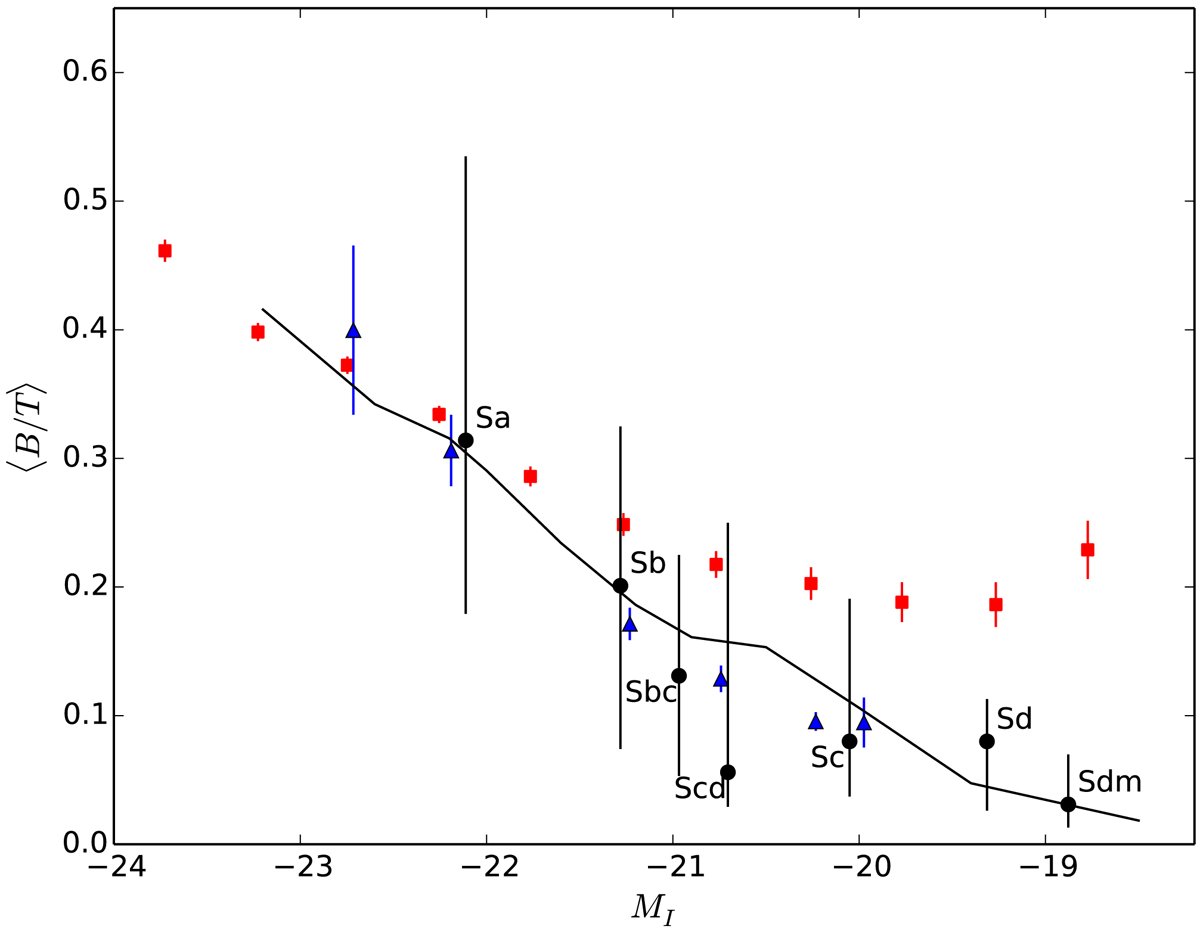
⟨B/T⟩ versus I-band magnitude MI. The black curve shows our prediction. The black circles are from Mathewson et al. (1992) when we assign to each Hubble type the ⟨B/T⟩ from Graham & Worley (2008; the uncertainty of estimating B/T determines the size of the error bars). The red squares are from Simard et al. (2011) after removing all galaxies with B/T > 0.7. The up-pointing filled blue triangles and the down-pointing empty blue triangles are from Salo et al. (2015), S4G) when we assign the bar to the bulge and the disc, respectively. The error bars on the red squares and the blue filled triangles show the standard error on the mean. We have not shown the error bars on the empty triangles so that they do not overlap with those on the filled triangles, but their width is comparable.
Current usage metrics show cumulative count of Article Views (full-text article views including HTML views, PDF and ePub downloads, according to the available data) and Abstracts Views on Vision4Press platform.
Data correspond to usage on the plateform after 2015. The current usage metrics is available 48-96 hours after online publication and is updated daily on week days.
Initial download of the metrics may take a while.