Fig. 1.
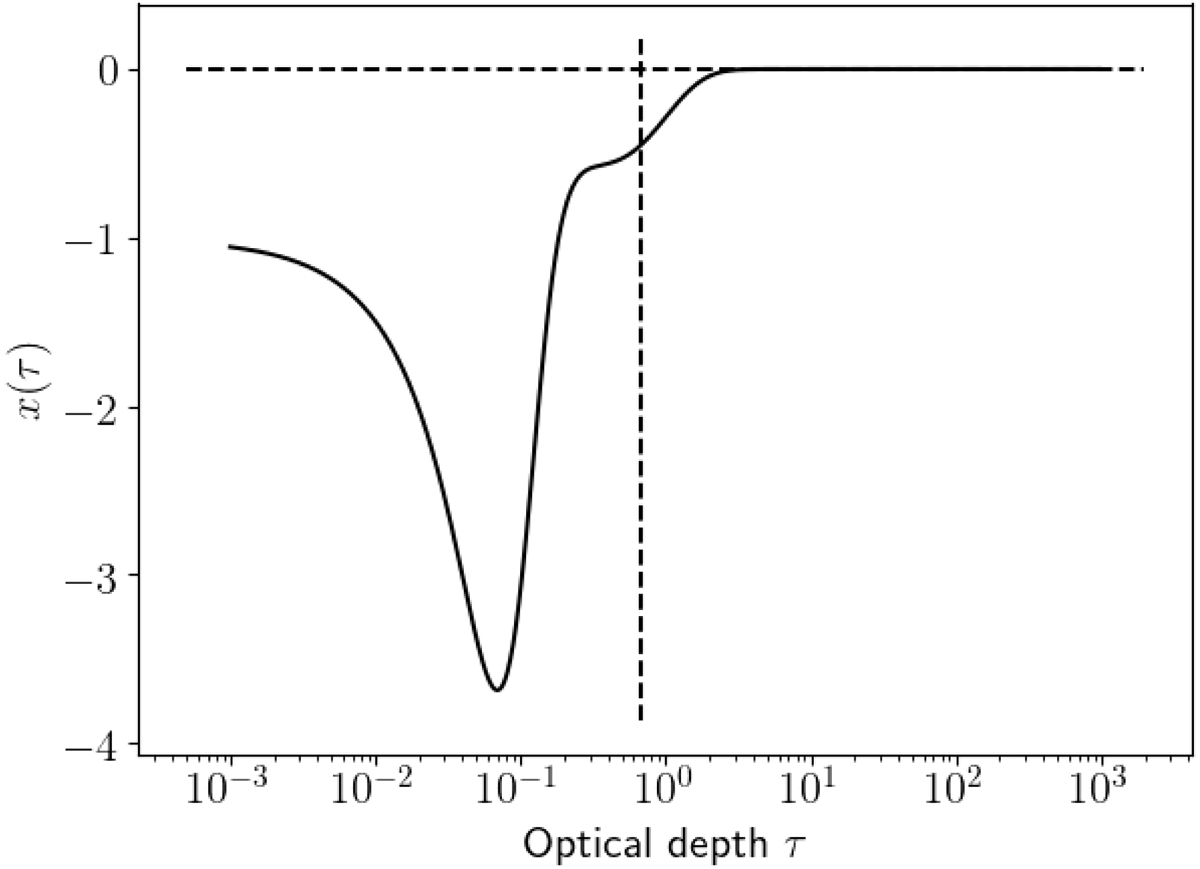
Quantity x(τ) defined by Eq. (14) as a function of optical depth τ, when the Hopf function given by Eq. (16) is adopted. The vertical dashed line corresponds to the radius of the photosphere (τ = 2/3), where the intensity power spectrum is observed. The τ-axis is oriented from left to right, so that the surface is on the left side of the figure, and the deeper layers on the right side.
Current usage metrics show cumulative count of Article Views (full-text article views including HTML views, PDF and ePub downloads, according to the available data) and Abstracts Views on Vision4Press platform.
Data correspond to usage on the plateform after 2015. The current usage metrics is available 48-96 hours after online publication and is updated daily on week days.
Initial download of the metrics may take a while.