Fig. 2
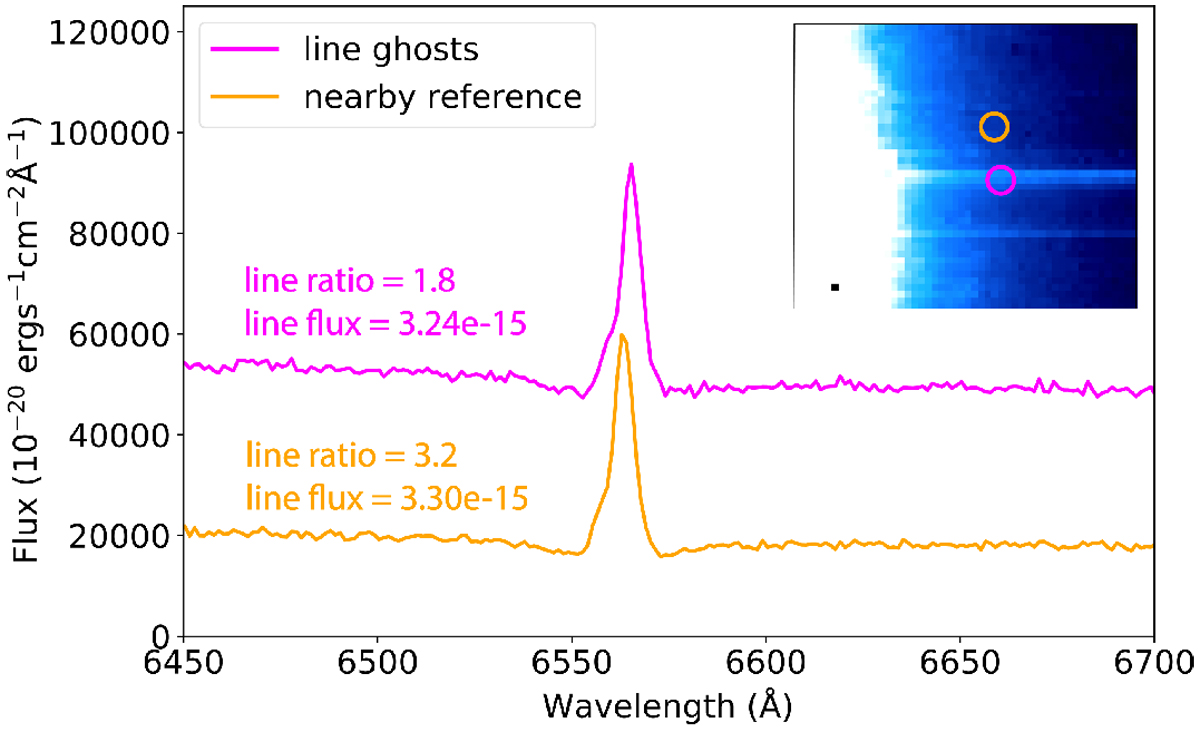
Illustration of the effect caused by line ghosts. The spectrum of the lines ghost is similar to the original spectrum with a lift of additional flux. The inset shows line ghosts in the zoomed-in image of HD 163296 at 6564 Å and the regions (orange and magenta circles) where the corresponding spectra were extracted. The line ratio is defined as peak line flux over the local continuum. The line flux was measured by fitting simple Gaussian profile with continuum removed. The line flux is in units of erg s−1 cm−2.
Current usage metrics show cumulative count of Article Views (full-text article views including HTML views, PDF and ePub downloads, according to the available data) and Abstracts Views on Vision4Press platform.
Data correspond to usage on the plateform after 2015. The current usage metrics is available 48-96 hours after online publication and is updated daily on week days.
Initial download of the metrics may take a while.