Fig. 1
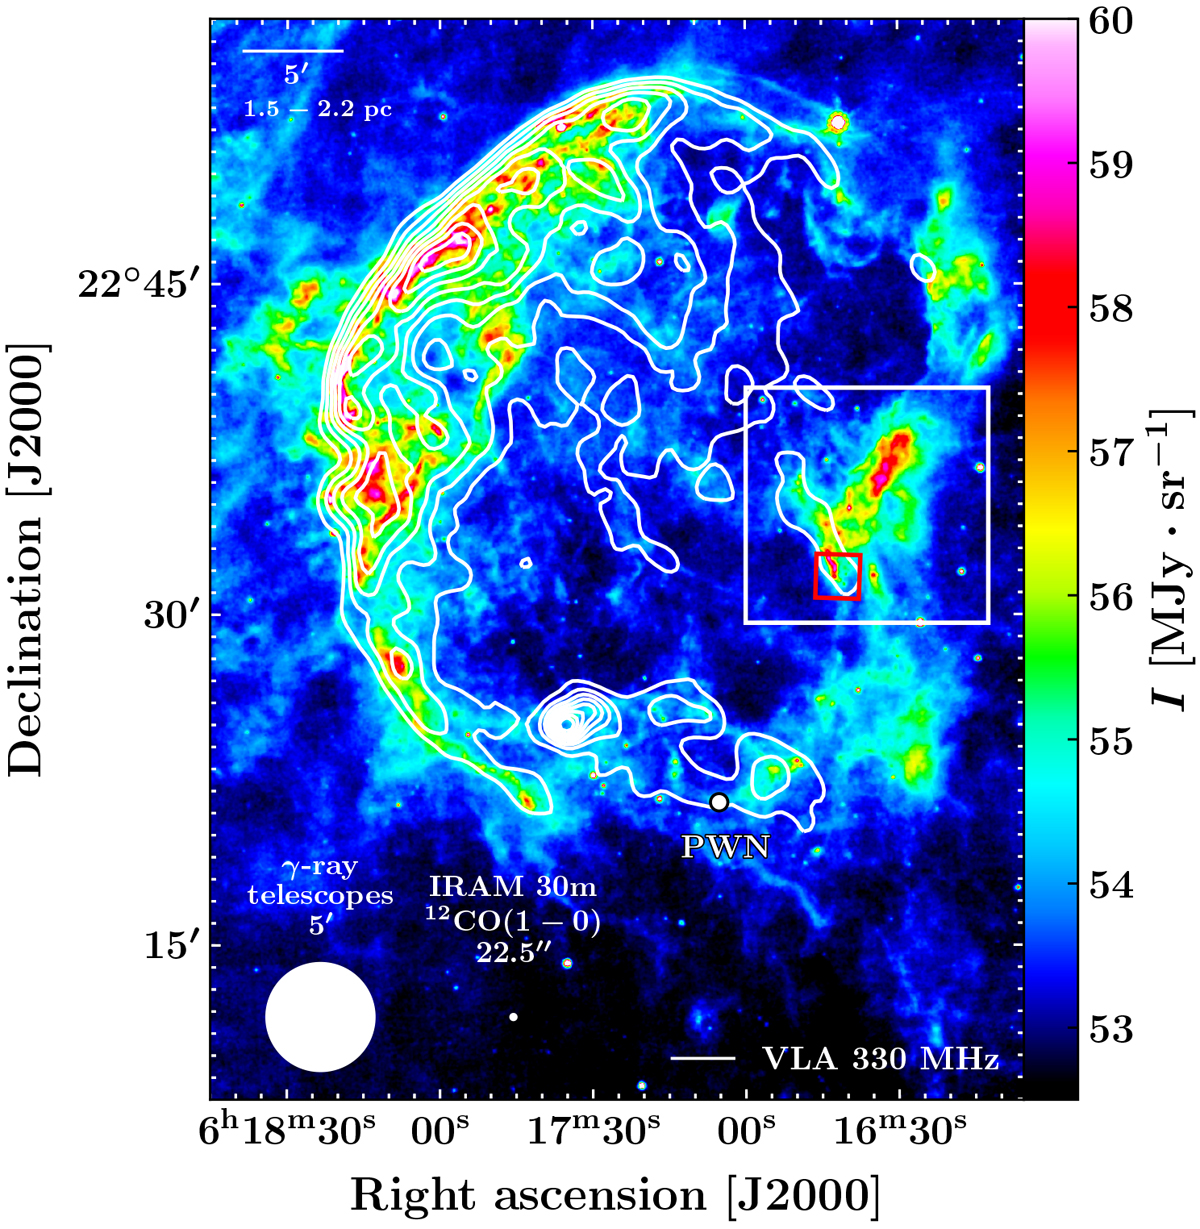
Spitzer/MIPS map (colors) of IC443 at 24 μm (Pinheiro Gonçalves et al. 2011; Noriega-Crespo et al. 2009). In contours, the VLA emission map shows the morphologyof the synchrotron emission at 330 MHz (Claussen et al. 1997). The white dot indicates the position of the PWN wind (Olbert et al. 2001b). The red box represents one of the fields observed by Spitzer-IRS (Neufeld et al. 2004), corresponding roughly to the G region defined by Huang et al. (1986). The white box represents the 10′ × 10′ field of our observations called “the extended G region”. The IRAM 30 m instrumental beam diameter corresponding to the 12CO(1–0) transition and the size of the typical PSF of γ-ray telescopes (5′) are indicated by white disks in the bottom left corner of the figure.
Current usage metrics show cumulative count of Article Views (full-text article views including HTML views, PDF and ePub downloads, according to the available data) and Abstracts Views on Vision4Press platform.
Data correspond to usage on the plateform after 2015. The current usage metrics is available 48-96 hours after online publication and is updated daily on week days.
Initial download of the metrics may take a while.