Fig. 10
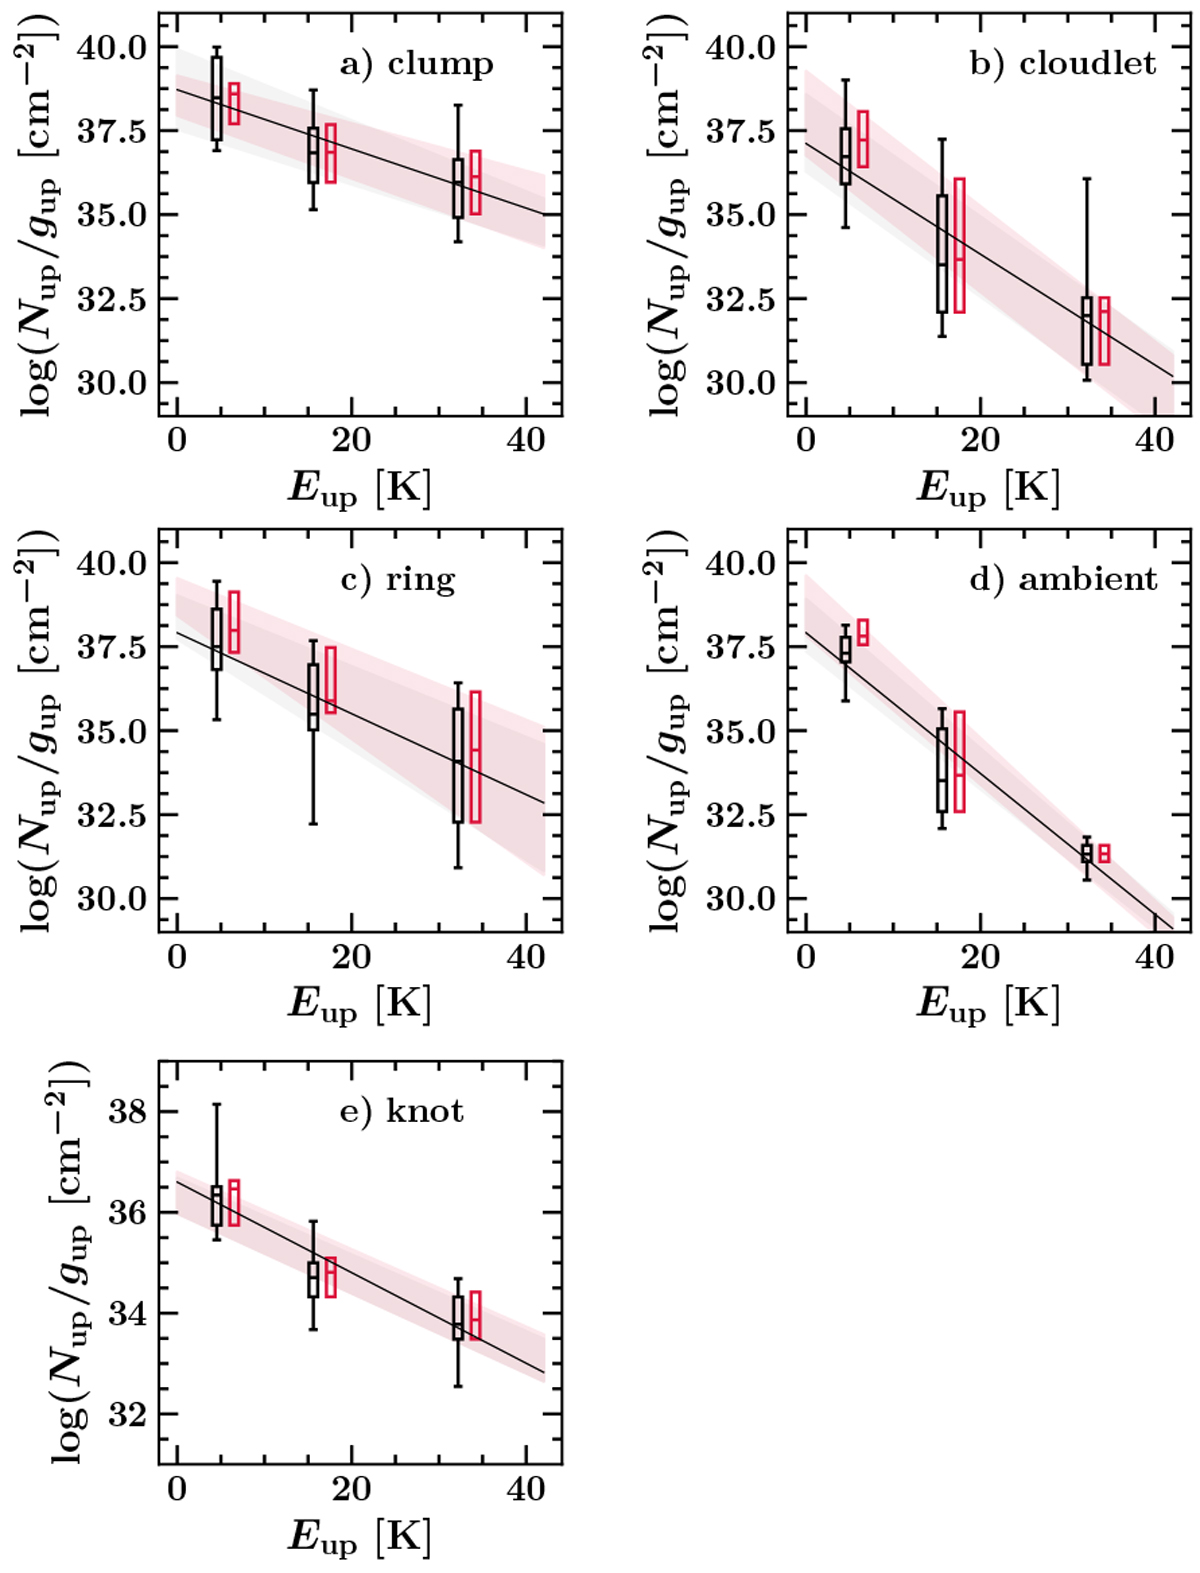
Average population diagrams of 12CO corrected for optical depth. The measured average, first quartile, third quartile, fifth percentile, and 95th percentile associated with our sample of level populations corresponding to Jup = 1, Jup = 2, and Jup = 3 are indicated for two adopted values of the 12CO/13CO isotopic ratio (12CO/13CO = 60 in black, 12CO/13CO = 100 in red). The black solid line represents the linear fit of the black data points. The boundaries of the filled areas are defined by the linear fits corresponding to the first and third quartiles for each value of the isotopic ratio adopted. The 5th percentile and 95th percentile are indicated by the caps, the first quartile and third quartile are indicated by the ends of the box, and the average is indicated by the cap inside of the box. Each diagram accounts for a sample of measurements performed in one of the spatial boxes defined in Fig. 6 and integration ranges defined in Table 6: (a) the shocked clump, (b) the cloudlet, (c) the ring, (d) the ambient cloud, and (e) the shocked knot.
Current usage metrics show cumulative count of Article Views (full-text article views including HTML views, PDF and ePub downloads, according to the available data) and Abstracts Views on Vision4Press platform.
Data correspond to usage on the plateform after 2015. The current usage metrics is available 48-96 hours after online publication and is updated daily on week days.
Initial download of the metrics may take a while.