Fig. 12
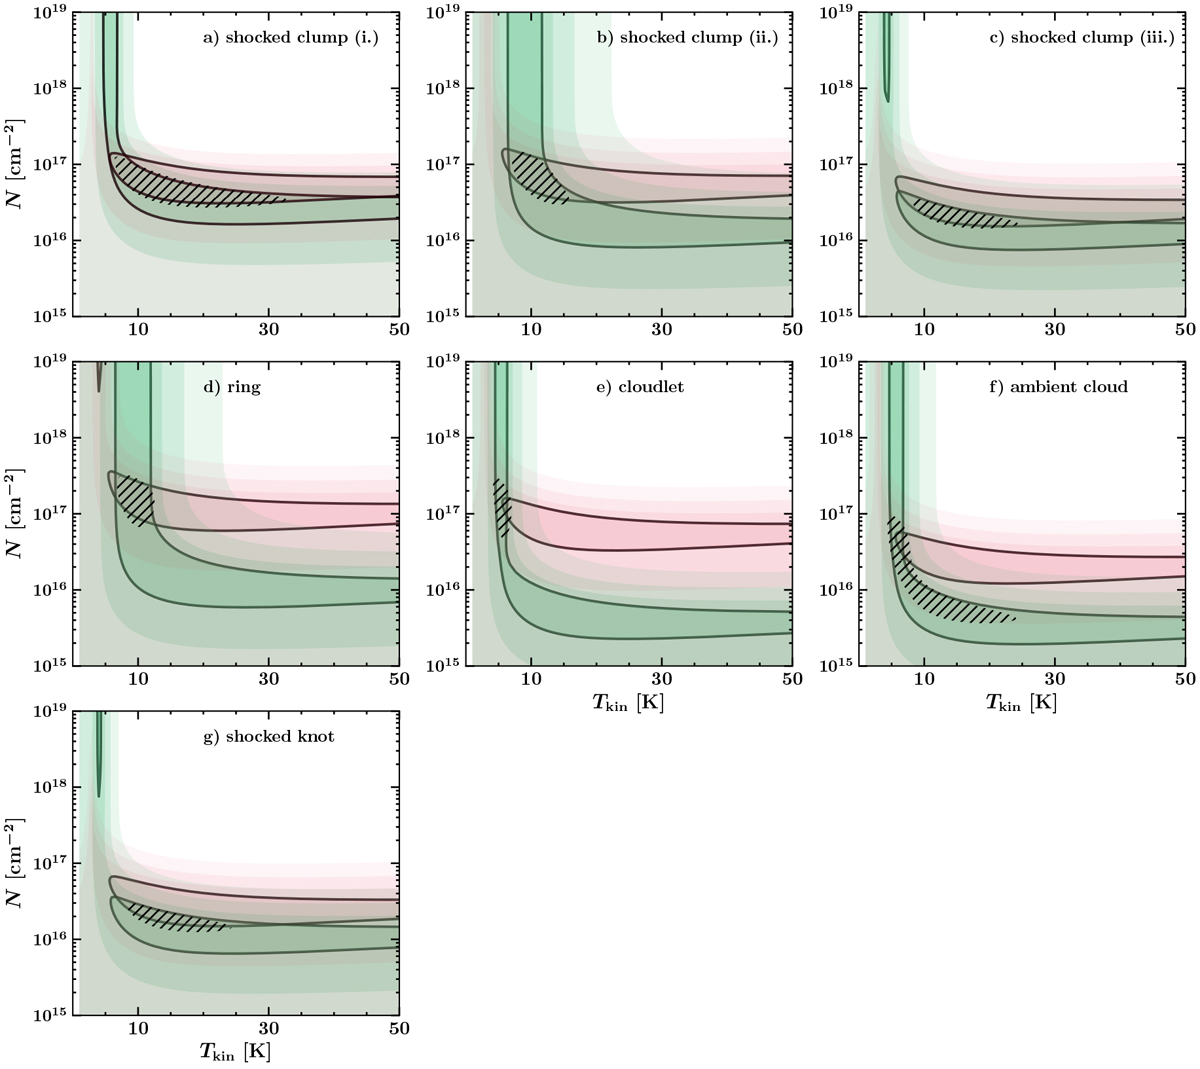
Diagrams of χ2 minimization of the comparison between 1 × 200 × 200 LVG grids modeled with sets of parameters (![]() ,
NCO,
T) and observations of 12CO and 13CO lines toward the boxes corresponding to the shocked clump (a−c), ring-like structure (d), cloudlet (e), ambient cloud (f), and shocked knot (g) defined in Table A.1. Shades of green represent the areas of minimum
χ2 corresponding to the minimization of the specific intensity of the 12CO(3–2),
12CO (2–1), and 12CO(1–0) lines (first term introduced in Eq. (12)), and the shades of pink represent the areas of minimum
χ2 corresponding to the minimization of 13CO lines (second term introduced in Eq. (12)). The filled contour levels are
log10 (χ2) = [0.6, 1, 1.5, 2]; the first contour level is highlighted by a solid black line. Hatched areas represent the intersection between the previously described sets of contours, defined by
,
NCO,
T) and observations of 12CO and 13CO lines toward the boxes corresponding to the shocked clump (a−c), ring-like structure (d), cloudlet (e), ambient cloud (f), and shocked knot (g) defined in Table A.1. Shades of green represent the areas of minimum
χ2 corresponding to the minimization of the specific intensity of the 12CO(3–2),
12CO (2–1), and 12CO(1–0) lines (first term introduced in Eq. (12)), and the shades of pink represent the areas of minimum
χ2 corresponding to the minimization of 13CO lines (second term introduced in Eq. (12)). The filled contour levels are
log10 (χ2) = [0.6, 1, 1.5, 2]; the first contour level is highlighted by a solid black line. Hatched areas represent the intersection between the previously described sets of contours, defined by
![]() (Eq. (12)) for boxes a−g, respectively.
(Eq. (12)) for boxes a−g, respectively.
Current usage metrics show cumulative count of Article Views (full-text article views including HTML views, PDF and ePub downloads, according to the available data) and Abstracts Views on Vision4Press platform.
Data correspond to usage on the plateform after 2015. The current usage metrics is available 48-96 hours after online publication and is updated daily on week days.
Initial download of the metrics may take a while.