Fig. 2
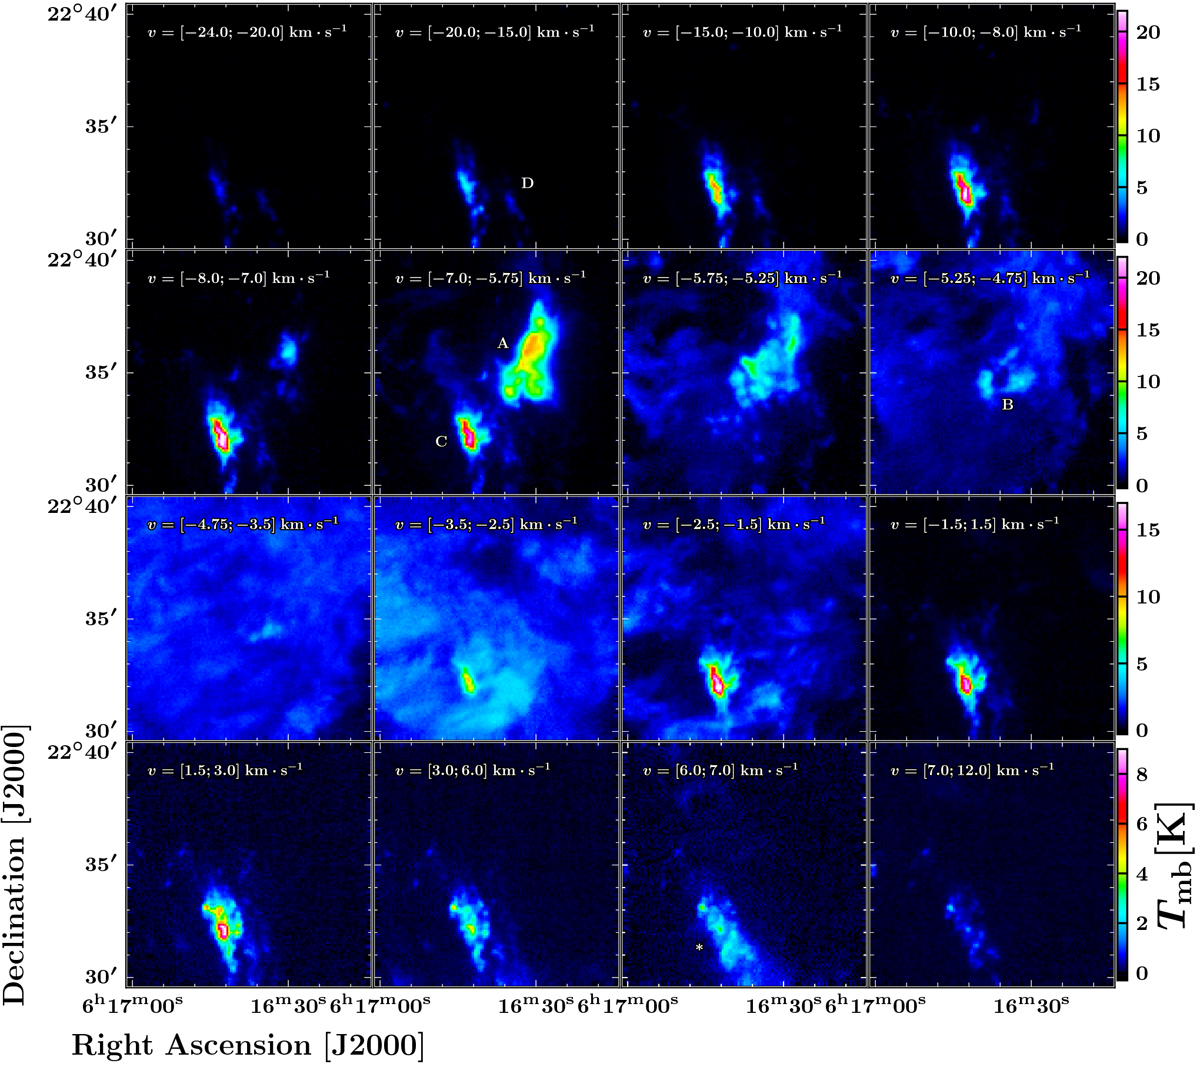
Channel maps of the 12CO(2–1) observations carried out with the IRAM 30 m telescope. Each panel represents the emission integratedover an interval of velocity along the line of sight. Velocity intervals are indicated on the top left corner of each panel. Velocity channels represented in this figure are between v = − 24 km s−1 and v = +12 km s−1, covering all the spectral features detected toward the extended G region. Structures described in Sect. 3.2are indicated with the corresponding letters.
Current usage metrics show cumulative count of Article Views (full-text article views including HTML views, PDF and ePub downloads, according to the available data) and Abstracts Views on Vision4Press platform.
Data correspond to usage on the plateform after 2015. The current usage metrics is available 48-96 hours after online publication and is updated daily on week days.
Initial download of the metrics may take a while.