Fig. E.1
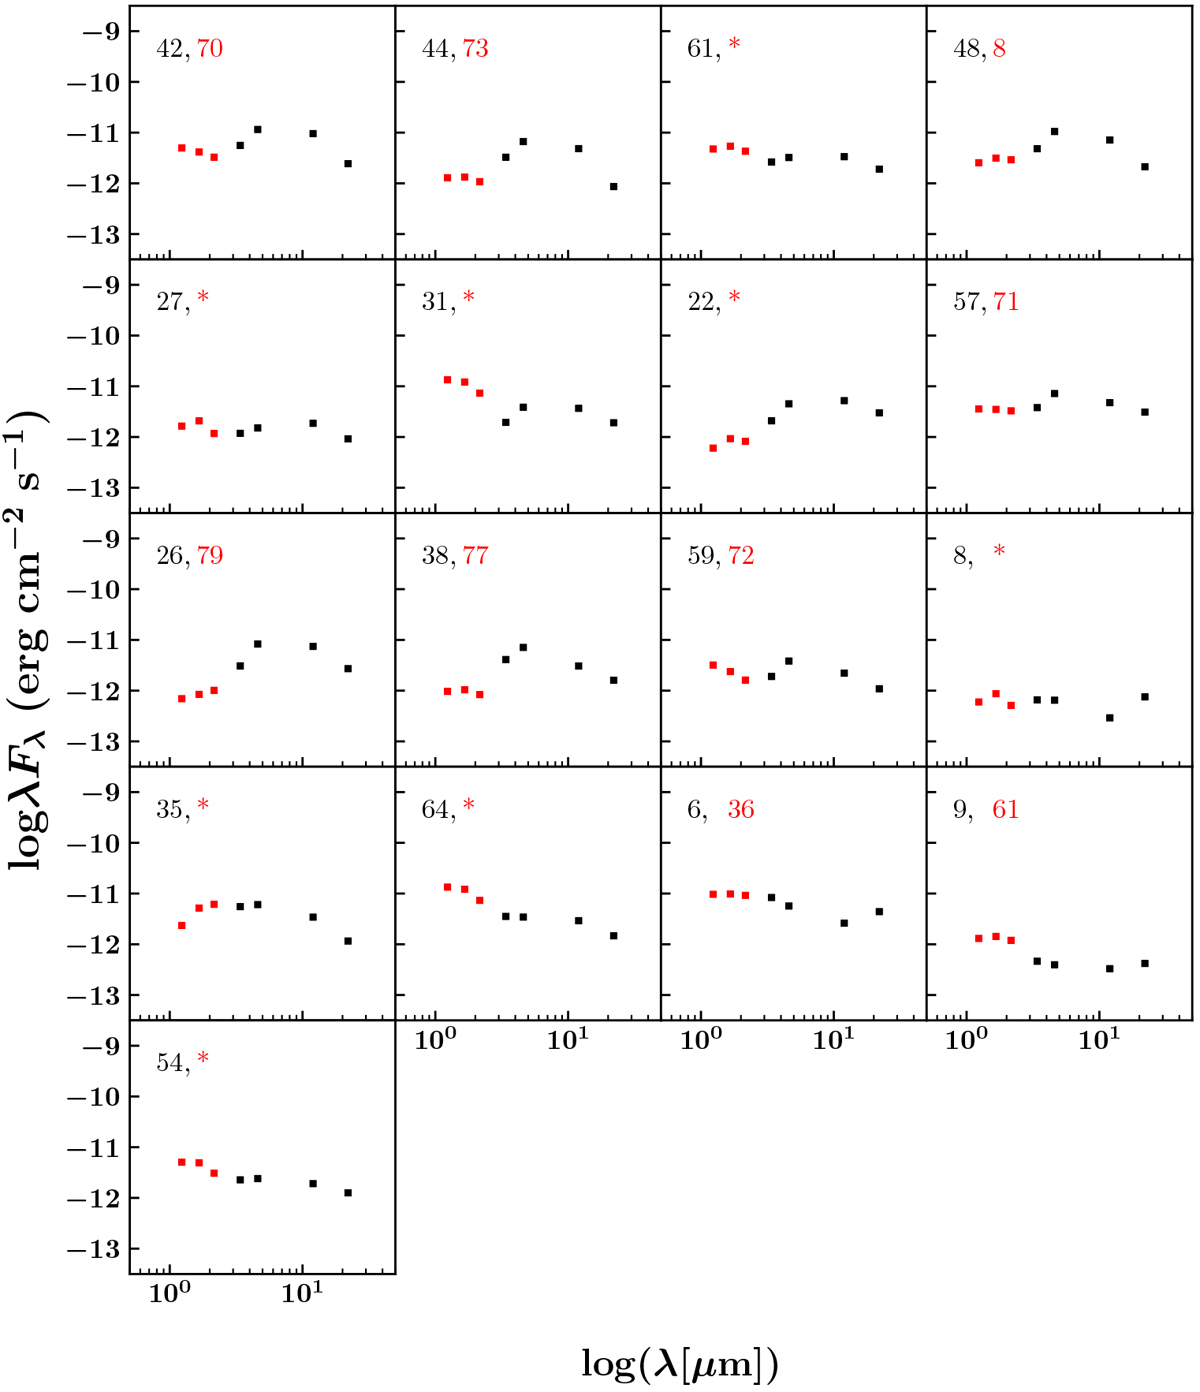
Spectral energy distributions of 17 protostar candidates. Their corresponding ID in Tables G.2and G.1 are indicated in the top left corner of each box when available (marked with an “*” if not corresponding to any point sources identified by a label). Red markers correspond to 2MASS photometric measures and black markers correspond to WISE measures.
Current usage metrics show cumulative count of Article Views (full-text article views including HTML views, PDF and ePub downloads, according to the available data) and Abstracts Views on Vision4Press platform.
Data correspond to usage on the plateform after 2015. The current usage metrics is available 48-96 hours after online publication and is updated daily on week days.
Initial download of the metrics may take a while.