Fig. F.1
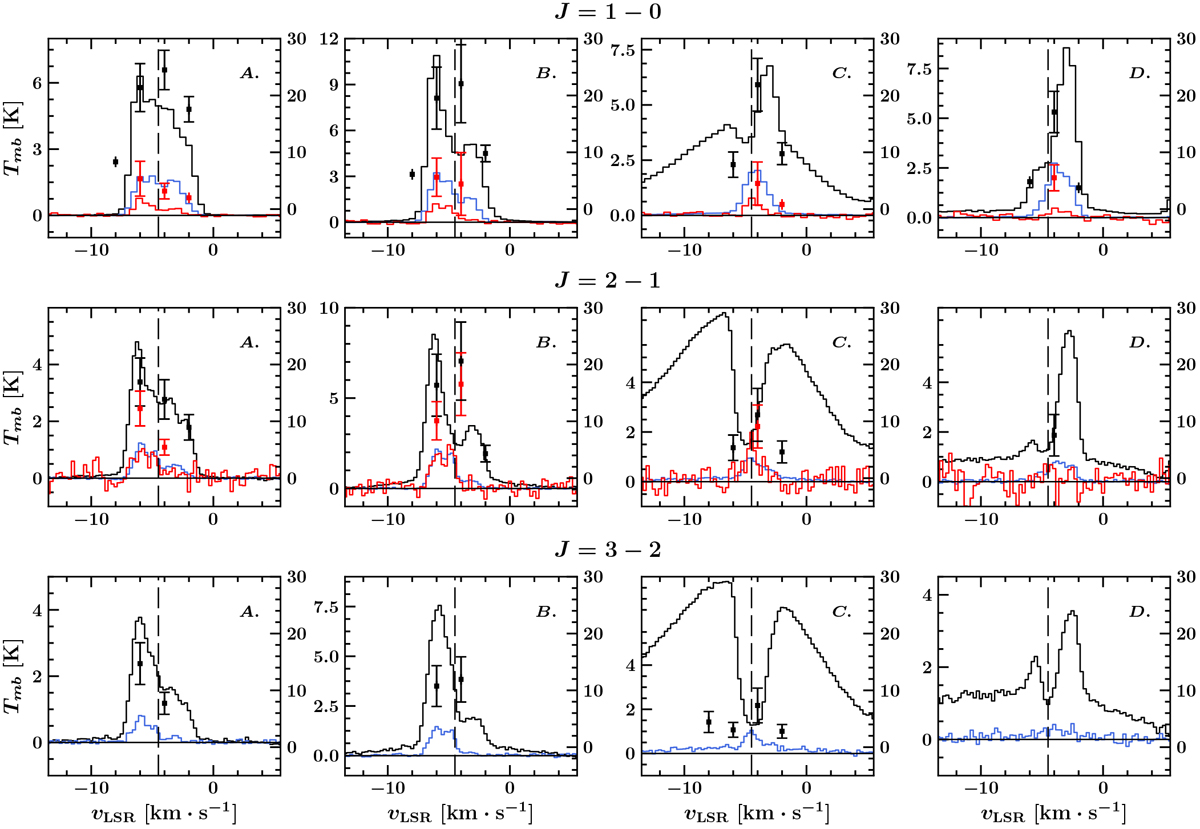
Spectra obtained over the region of the four boxes defined in Fig. 6, for the following lines: 12CO (in black), 13CO (in blue), and C18O (in red). First row: (1–0) transition, second row: (2–1) transition, and third row: (3–2) transition for: A, the cloudlet; B, the ring-likestructure; C, the shocked clump; and D, the shocked knot. Spectral cubes were resampled to allow a direct comparison between the different spectra. Spatial resolutions of all transitions were modified to the nominal resolution of C18O (2–1), θ = 30.2′′. Spectral resolution were set to 0.5 km s−1 for the IRAM 30 m data, and 0.25 km s−1 for APEX data. On both panels, the vLSR of IC443 is indicated with a vertical dashed line (at − 4.5 km s−1). The black data points with error bars represent the measurements of the optical depth τ corresponding to each channel of these spectra resampled with a spectral resolution of 2 km s−1, using the [12CO]/[13CO] ratio as a tracer, and the red data points represent the measurements of the optical depth obtained using the [12CO]/[C18O] ratio. The adopted values for the isotopic ratios are based on the results of Sect. 4.2.1 and indicated in Table 5.
Current usage metrics show cumulative count of Article Views (full-text article views including HTML views, PDF and ePub downloads, according to the available data) and Abstracts Views on Vision4Press platform.
Data correspond to usage on the plateform after 2015. The current usage metrics is available 48-96 hours after online publication and is updated daily on week days.
Initial download of the metrics may take a while.