Fig. 6
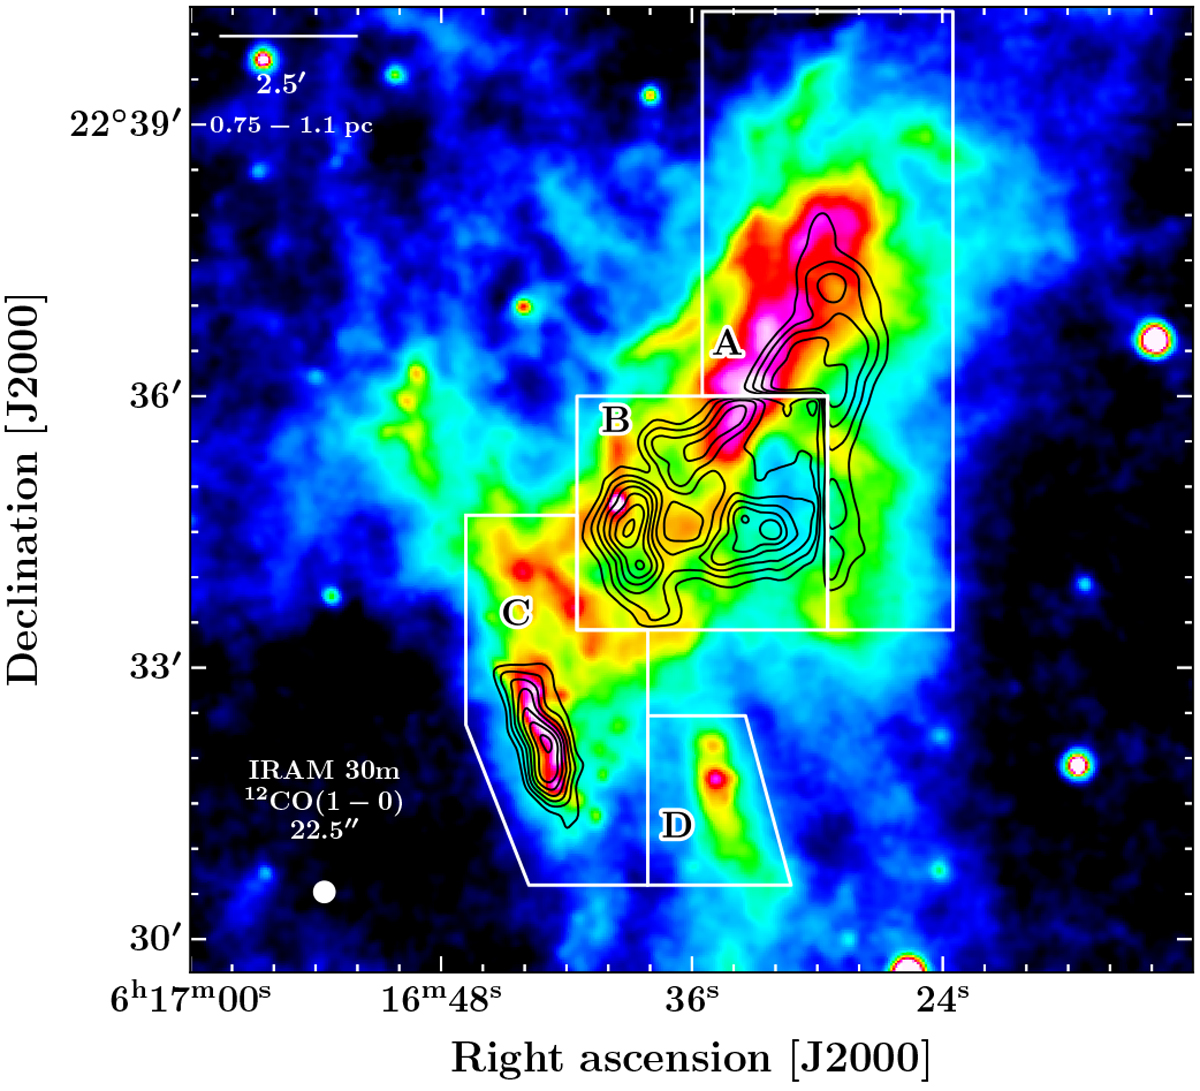
Spitzer/MIPS map at 24.0 μm. In black contours, the emission of 12CO(2–1) observedwith the IRAM 30 m is shown over different intervals of velocities: A [−7; −5] km s−1 (cloudlet); B[−5.5; −4.5] km s−1 (ring-like structure); and C and D [−40; +30] km s−1 (shocked clump and shocked knot). The white boxes represent the area where the signal corresponding to each structure is integrated. The beam diameter of the IRAM 30 m observations of 12CO(2–1) is shown in the bottom left corner.
Current usage metrics show cumulative count of Article Views (full-text article views including HTML views, PDF and ePub downloads, according to the available data) and Abstracts Views on Vision4Press platform.
Data correspond to usage on the plateform after 2015. The current usage metrics is available 48-96 hours after online publication and is updated daily on week days.
Initial download of the metrics may take a while.