Fig. 9
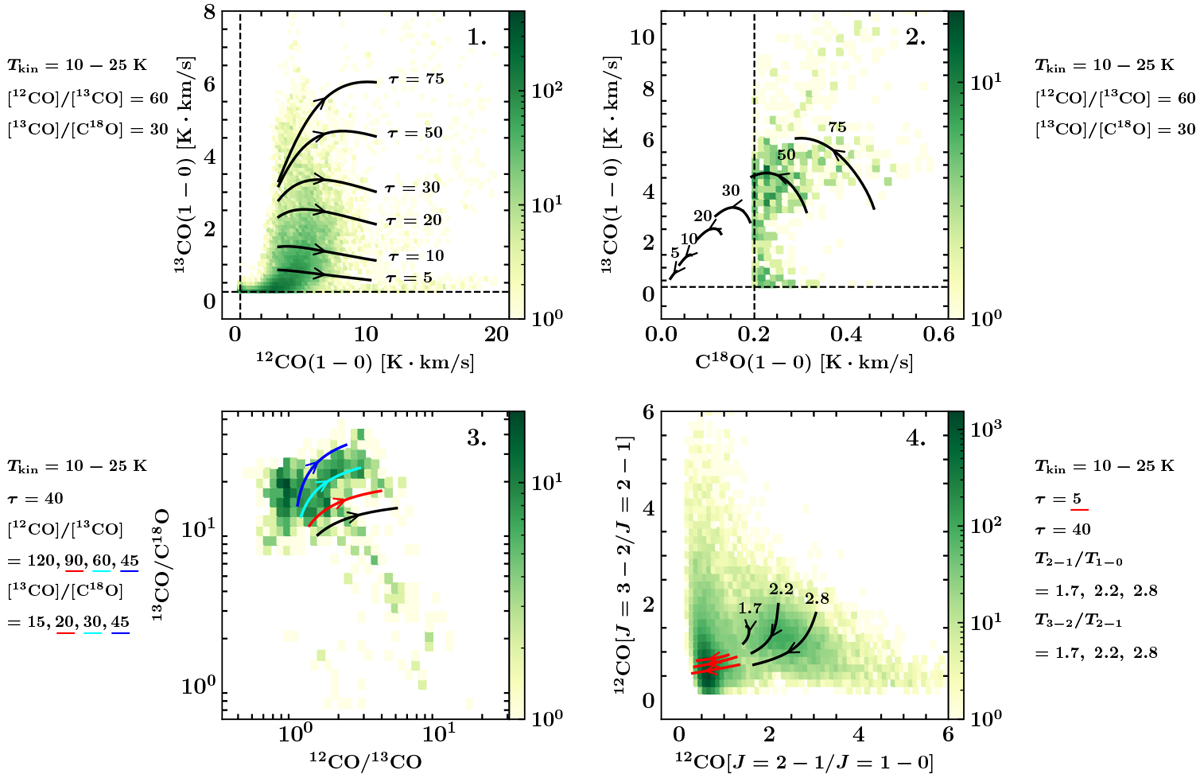
Data histograms and LTE models of the emission of the rotational transitions of 12CO and its isotopologs mapped in the extended G field with the IRAM 30 m and APEX: 1. 13CO (1–0) vs. 12CO(1–0); 2. 13CO (1–0) vs. C18O(1–0); 3. [13CO(1–0)] / [C18O (1–0)] vs. [12CO(1–0)] / [13CO (1–0)]; and 4. 12CO(3–2) / 12CO (2–1) vs. 12CO(2–1) / 12CO (1–0). The color map corresponds to the amount of data points (line of sight and velocity channels) that fall into a given bin of the histogram. The curves represent families of models of the LTE intensity as a function of the kinetic temperature of 13CO. The arrows indicate the direction in which the kinetic temperature grows along a given curve. Control parameters of the LTEmodels are given in Table 4 for each histogram. The dashed black lines represent the 3σ detection level for each axis (histograms 1 and 2).
Current usage metrics show cumulative count of Article Views (full-text article views including HTML views, PDF and ePub downloads, according to the available data) and Abstracts Views on Vision4Press platform.
Data correspond to usage on the plateform after 2015. The current usage metrics is available 48-96 hours after online publication and is updated daily on week days.
Initial download of the metrics may take a while.