Fig. 1
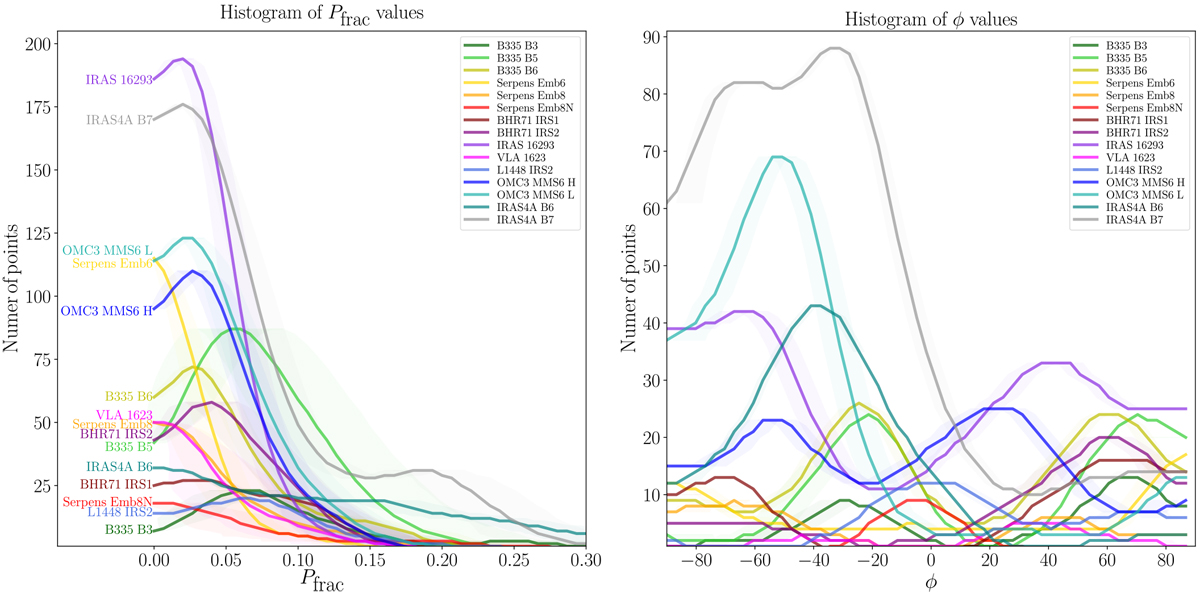
Histograms of polarization fraction ![]() (left) and polarization position angle ϕ
(right) for all the sources of our sample. The histogram lines have been smoothed with a 1D-Gaussian kernel of a size of 0.2% in
(left) and polarization position angle ϕ
(right) for all the sources of our sample. The histogram lines have been smoothed with a 1D-Gaussian kernel of a size of 0.2% in ![]() and 2°
in ϕ. The shaded areas correspond to the mean of the uncertainty in the values of
and 2°
in ϕ. The shaded areas correspond to the mean of the uncertainty in the values of
![]() and ϕ
within eachbin of the histograms. Among the two datasets we have toward OMC3 MMS6, “OMC3 MMS6 H” and “OMC3 MMS6 L” denote the high and low resolution observations, respectively.
and ϕ
within eachbin of the histograms. Among the two datasets we have toward OMC3 MMS6, “OMC3 MMS6 H” and “OMC3 MMS6 L” denote the high and low resolution observations, respectively.
Current usage metrics show cumulative count of Article Views (full-text article views including HTML views, PDF and ePub downloads, according to the available data) and Abstracts Views on Vision4Press platform.
Data correspond to usage on the plateform after 2015. The current usage metrics is available 48-96 hours after online publication and is updated daily on week days.
Initial download of the metrics may take a while.