Fig. E.1
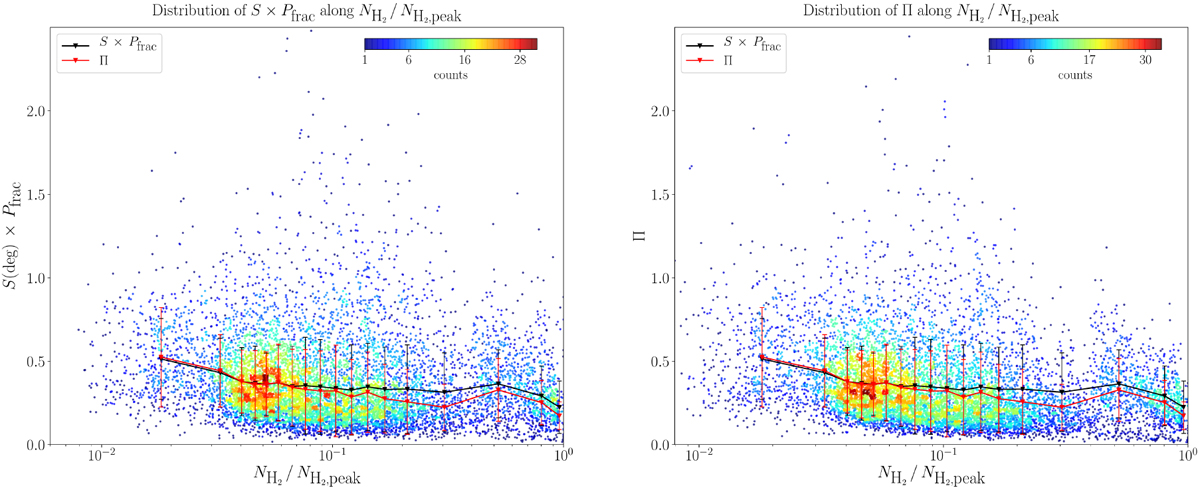
Distributions of ![]() (left) and Π
(right) as a function of the column density
(left) and Π
(right) as a function of the column density ![]() , normalized in each core by its maximum value
, normalized in each core by its maximum value ![]() . The color scale represents number density of points in the plots. The solid black (red) lines and black (red) points represent the running mean of
. The color scale represents number density of points in the plots. The solid black (red) lines and black (red) points represent the running mean of ![]() (Π); the associated error bars are ± the standard deviation of each bin. To facilitate the visual comparison, the running means of both
(Π); the associated error bars are ± the standard deviation of each bin. To facilitate the visual comparison, the running means of both
![]() and Π
a re plotted in both panels.
and Π
a re plotted in both panels.
Current usage metrics show cumulative count of Article Views (full-text article views including HTML views, PDF and ePub downloads, according to the available data) and Abstracts Views on Vision4Press platform.
Data correspond to usage on the plateform after 2015. The current usage metrics is available 48-96 hours after online publication and is updated daily on week days.
Initial download of the metrics may take a while.