Fig. 6
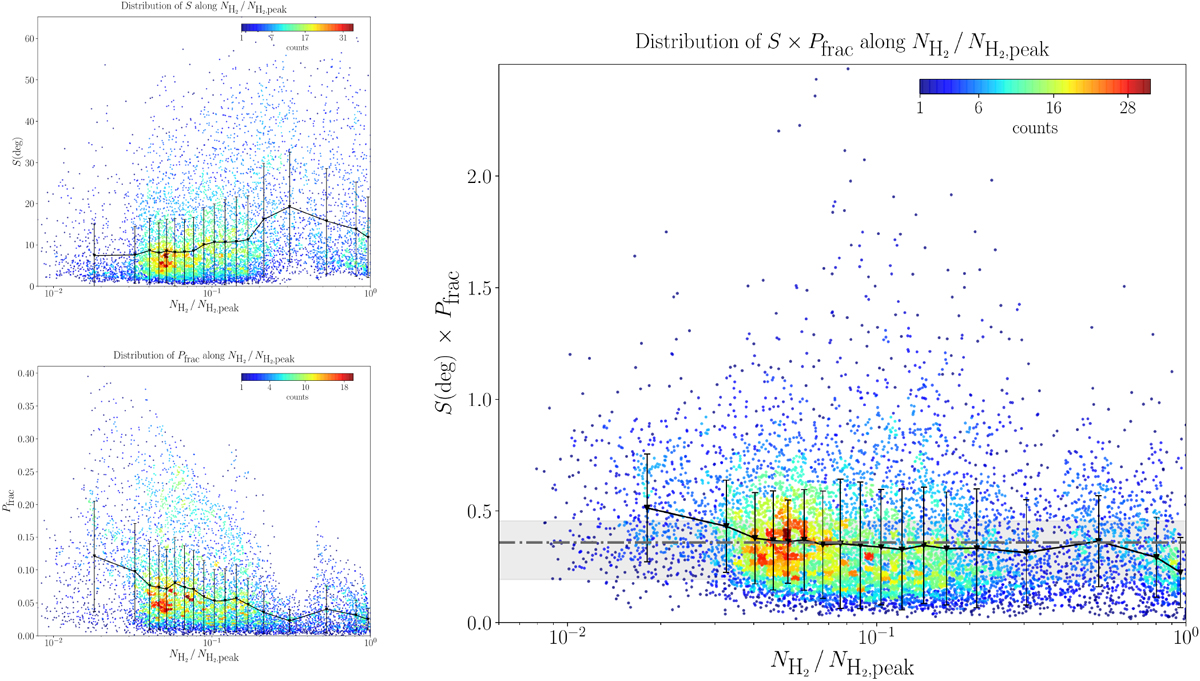
Same as Fig. 5, but where the column density in each core has been normalized to the column density peak ![]() . The horizontal dot-dashed gray line indicates the mean of all the
. The horizontal dot-dashed gray line indicates the mean of all the ![]() values,
values, ![]() . These uncertainty values are represented by the shaded area, which spans the range between the first and third quartiles of the
. These uncertainty values are represented by the shaded area, which spans the range between the first and third quartiles of the ![]() distribution.
distribution.
Current usage metrics show cumulative count of Article Views (full-text article views including HTML views, PDF and ePub downloads, according to the available data) and Abstracts Views on Vision4Press platform.
Data correspond to usage on the plateform after 2015. The current usage metrics is available 48-96 hours after online publication and is updated daily on week days.
Initial download of the metrics may take a while.