Fig. 2.
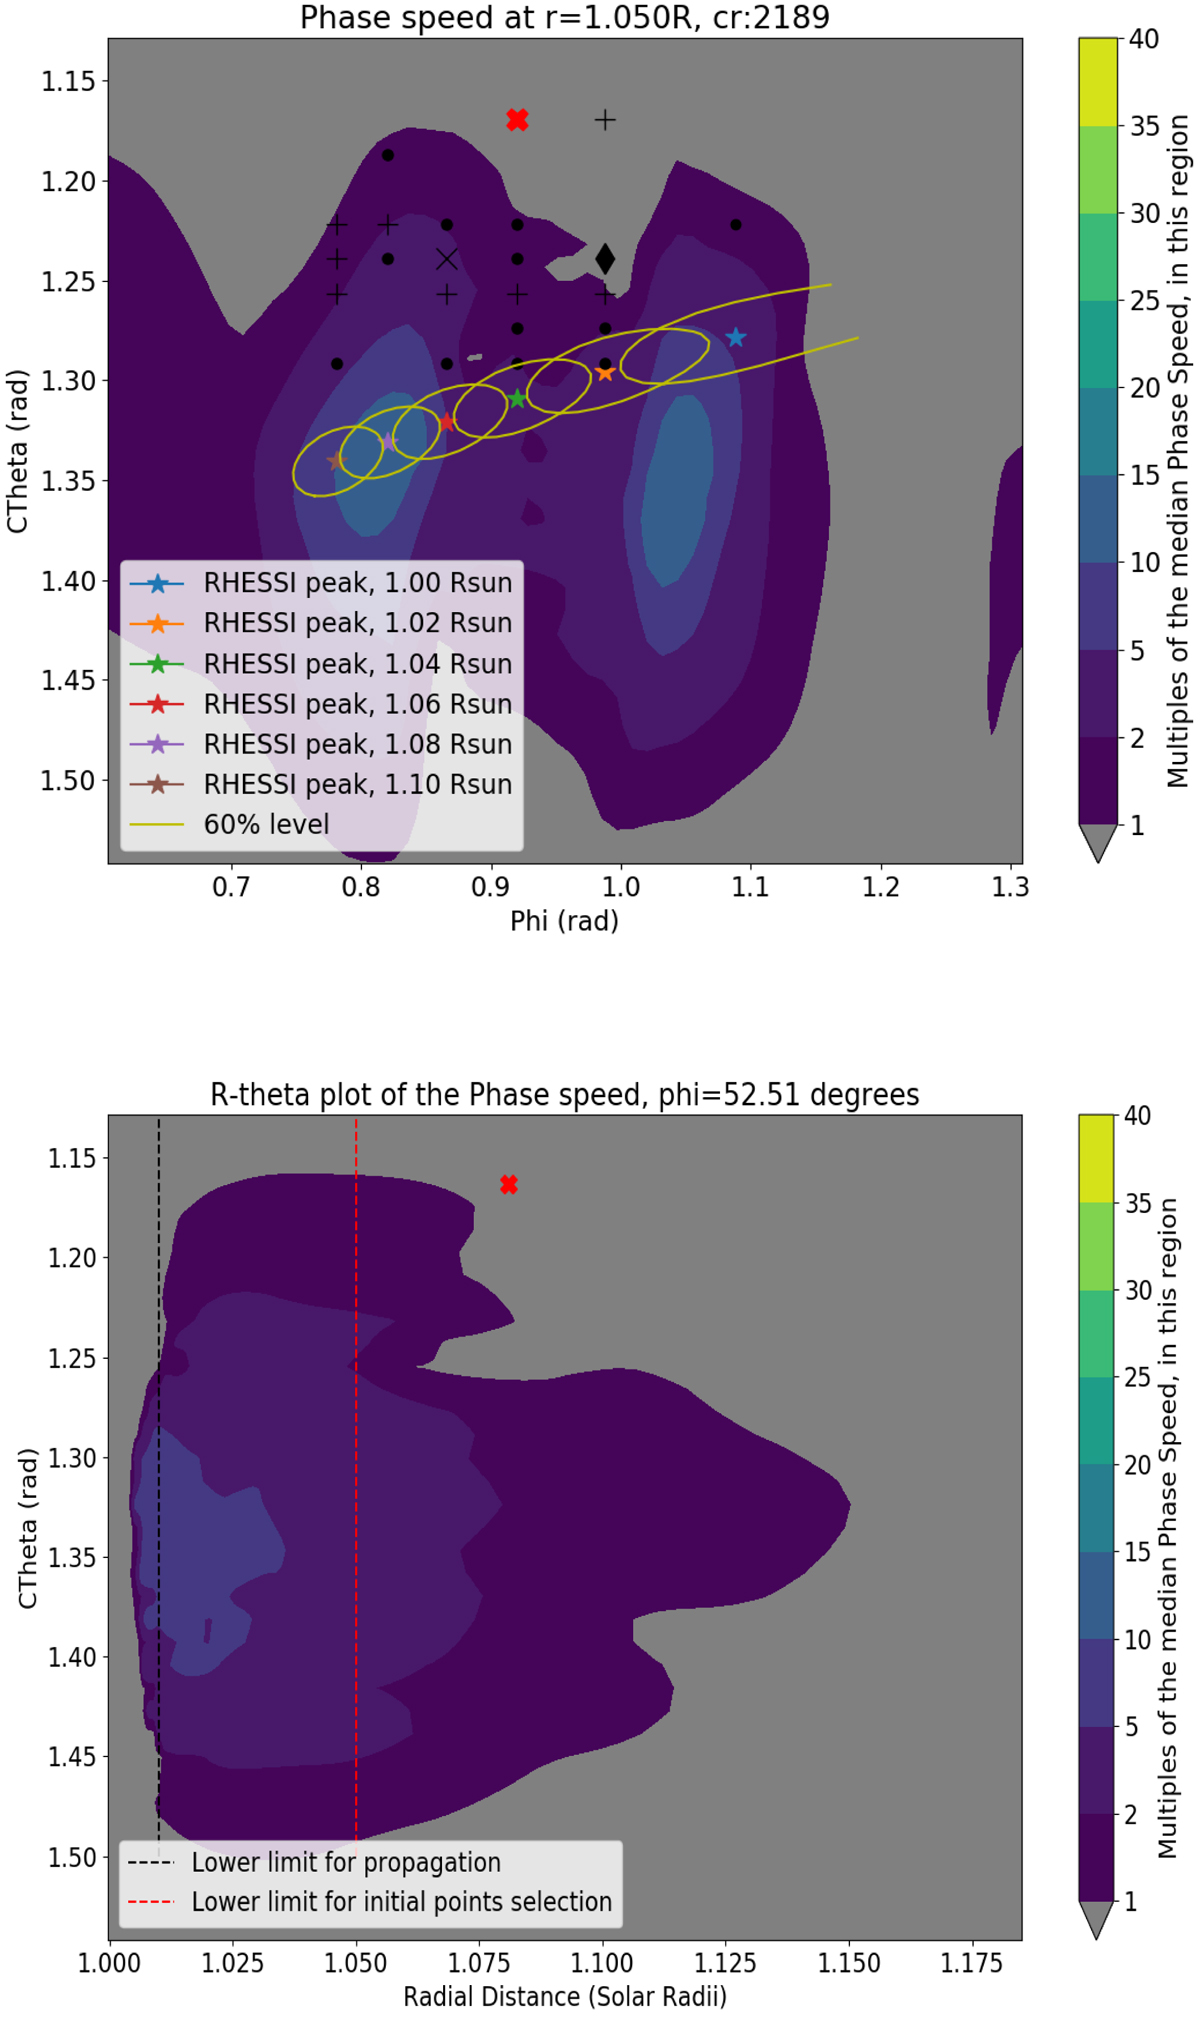
Top: EUV wave origin points that were tested, on top of the local phase speed data, for Event 1. The deprojected RHESSI peak coordinates (stars) together with the 60% contours (yellow) are also plotted, taking into account different source heights. The black marks of the points indicate the number of different heights that were tested (circle: 1, cross: 2, ex: 3, diamond: 4) and the point that was selected for the continuation of the analysis is indicated in red. Bottom: R-Theta plot of the local phase speed, with two vertical dashed lines indicating (black) the lower limit above which the wave can propagate and (red) the lower limit for most of the origin points that were tested. The red X symbol indicates the selected origin point.
Current usage metrics show cumulative count of Article Views (full-text article views including HTML views, PDF and ePub downloads, according to the available data) and Abstracts Views on Vision4Press platform.
Data correspond to usage on the plateform after 2015. The current usage metrics is available 48-96 hours after online publication and is updated daily on week days.
Initial download of the metrics may take a while.