Fig. 8.
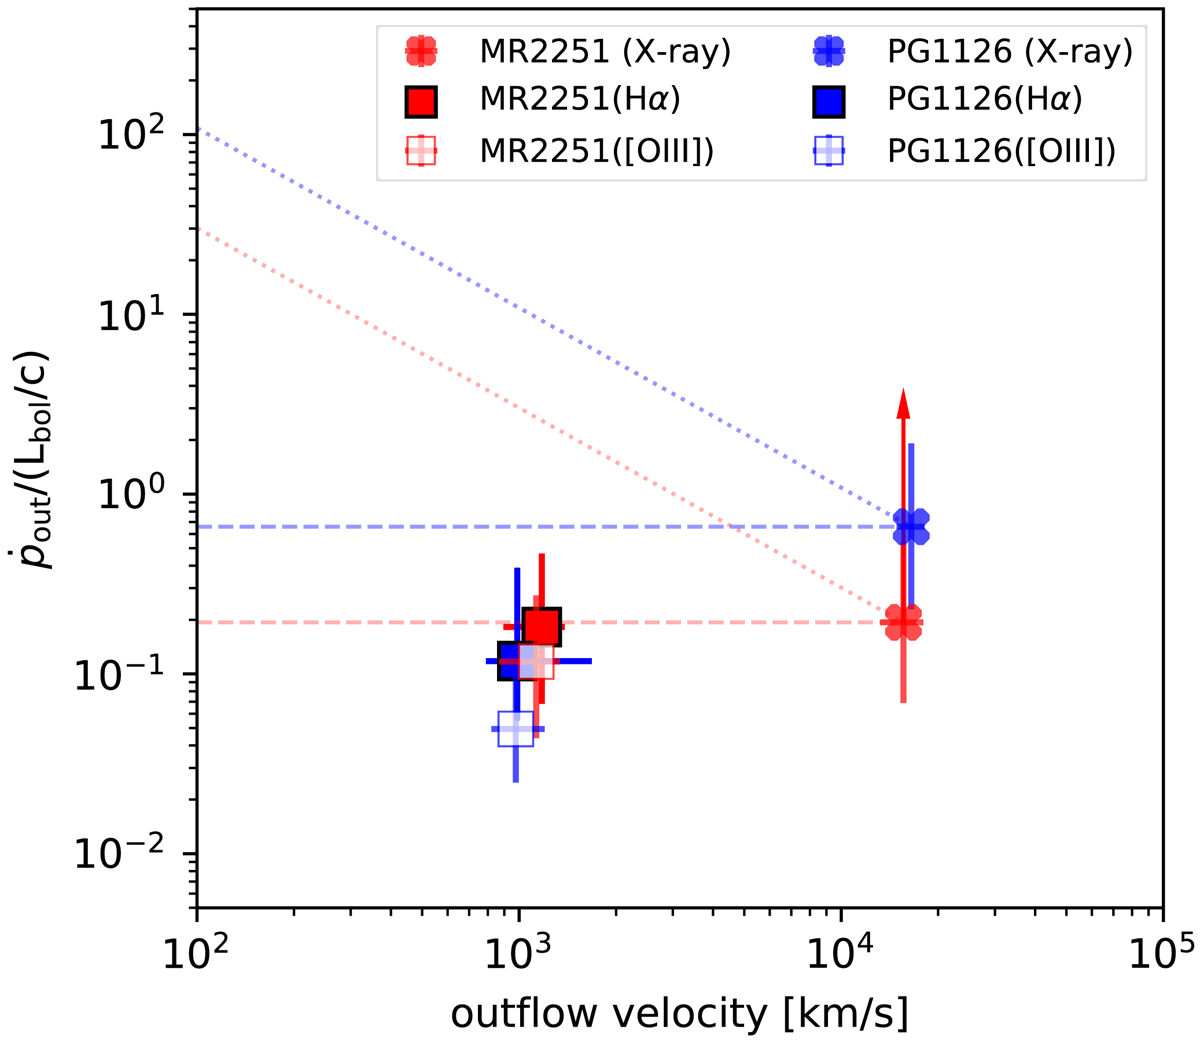
Momentum boost for MR 2251−178 (red markers) and PG 1126−041 (blue markers) as a function of the outflow velocity. Crosses show the high-speed, sub-pc-scale wind observed in X-ray by Reeves et al. (2013) and Giustini et al. (2011) (see text). Filled and empty squares are used for the kpc-scale ionised outflow from the Hα and [O III] lines, respectively, as derived in this work. Dashed horizontal (dotted diagonal) lines show predictions for a momentum-driven (energy-driven) wind.
Current usage metrics show cumulative count of Article Views (full-text article views including HTML views, PDF and ePub downloads, according to the available data) and Abstracts Views on Vision4Press platform.
Data correspond to usage on the plateform after 2015. The current usage metrics is available 48-96 hours after online publication and is updated daily on week days.
Initial download of the metrics may take a while.