Fig. 6.
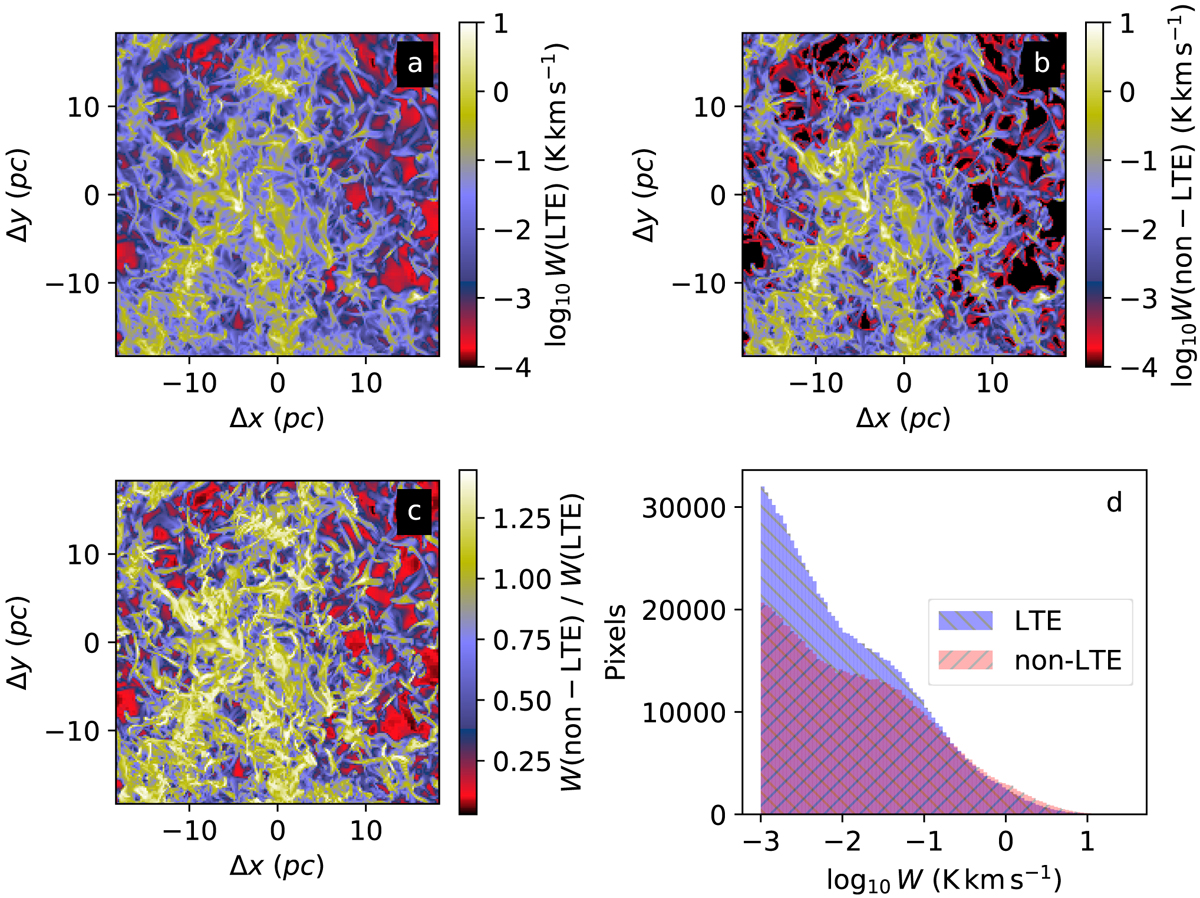
Comparison of LTE (frame a) and non-LTE (frame b) predictions of W(13CO) for a region within the large-scale ISM simulation. The ratio of the LTE and non-LTE maps is shown in frame c. The corresponding histograms of W(13CO) values (above 10−3 K km s−1) are shown in frame d. The selected region is indicated in Fig. 5c with a white box.
Current usage metrics show cumulative count of Article Views (full-text article views including HTML views, PDF and ePub downloads, according to the available data) and Abstracts Views on Vision4Press platform.
Data correspond to usage on the plateform after 2015. The current usage metrics is available 48-96 hours after online publication and is updated daily on week days.
Initial download of the metrics may take a while.