Fig. 10.
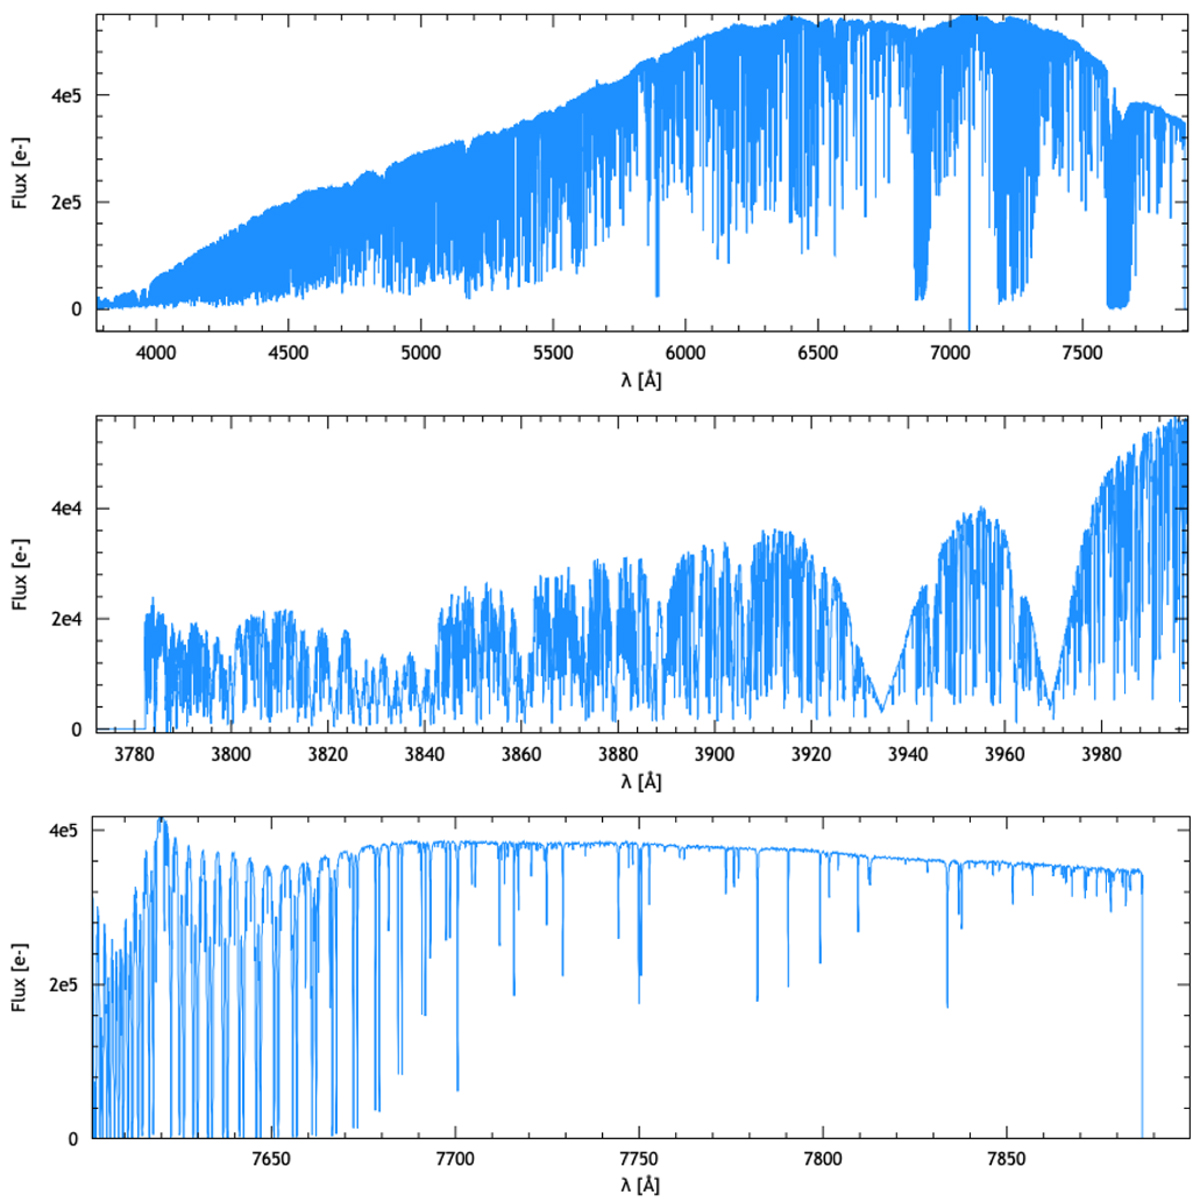
Top panel: full extracted and wavelength calibrated spectrum of τ-Cet observed with ESPRESSO in UHR mode. Middle panel: zoom-in on the blue end of the spectrum emphasizing the calcium doublet on the right side. Bottom panel: zoom-in on the red end of the spectrum showing the deep and narrow sequence of telluric absorption lines on the left side.
Current usage metrics show cumulative count of Article Views (full-text article views including HTML views, PDF and ePub downloads, according to the available data) and Abstracts Views on Vision4Press platform.
Data correspond to usage on the plateform after 2015. The current usage metrics is available 48-96 hours after online publication and is updated daily on week days.
Initial download of the metrics may take a while.