Fig. 11.
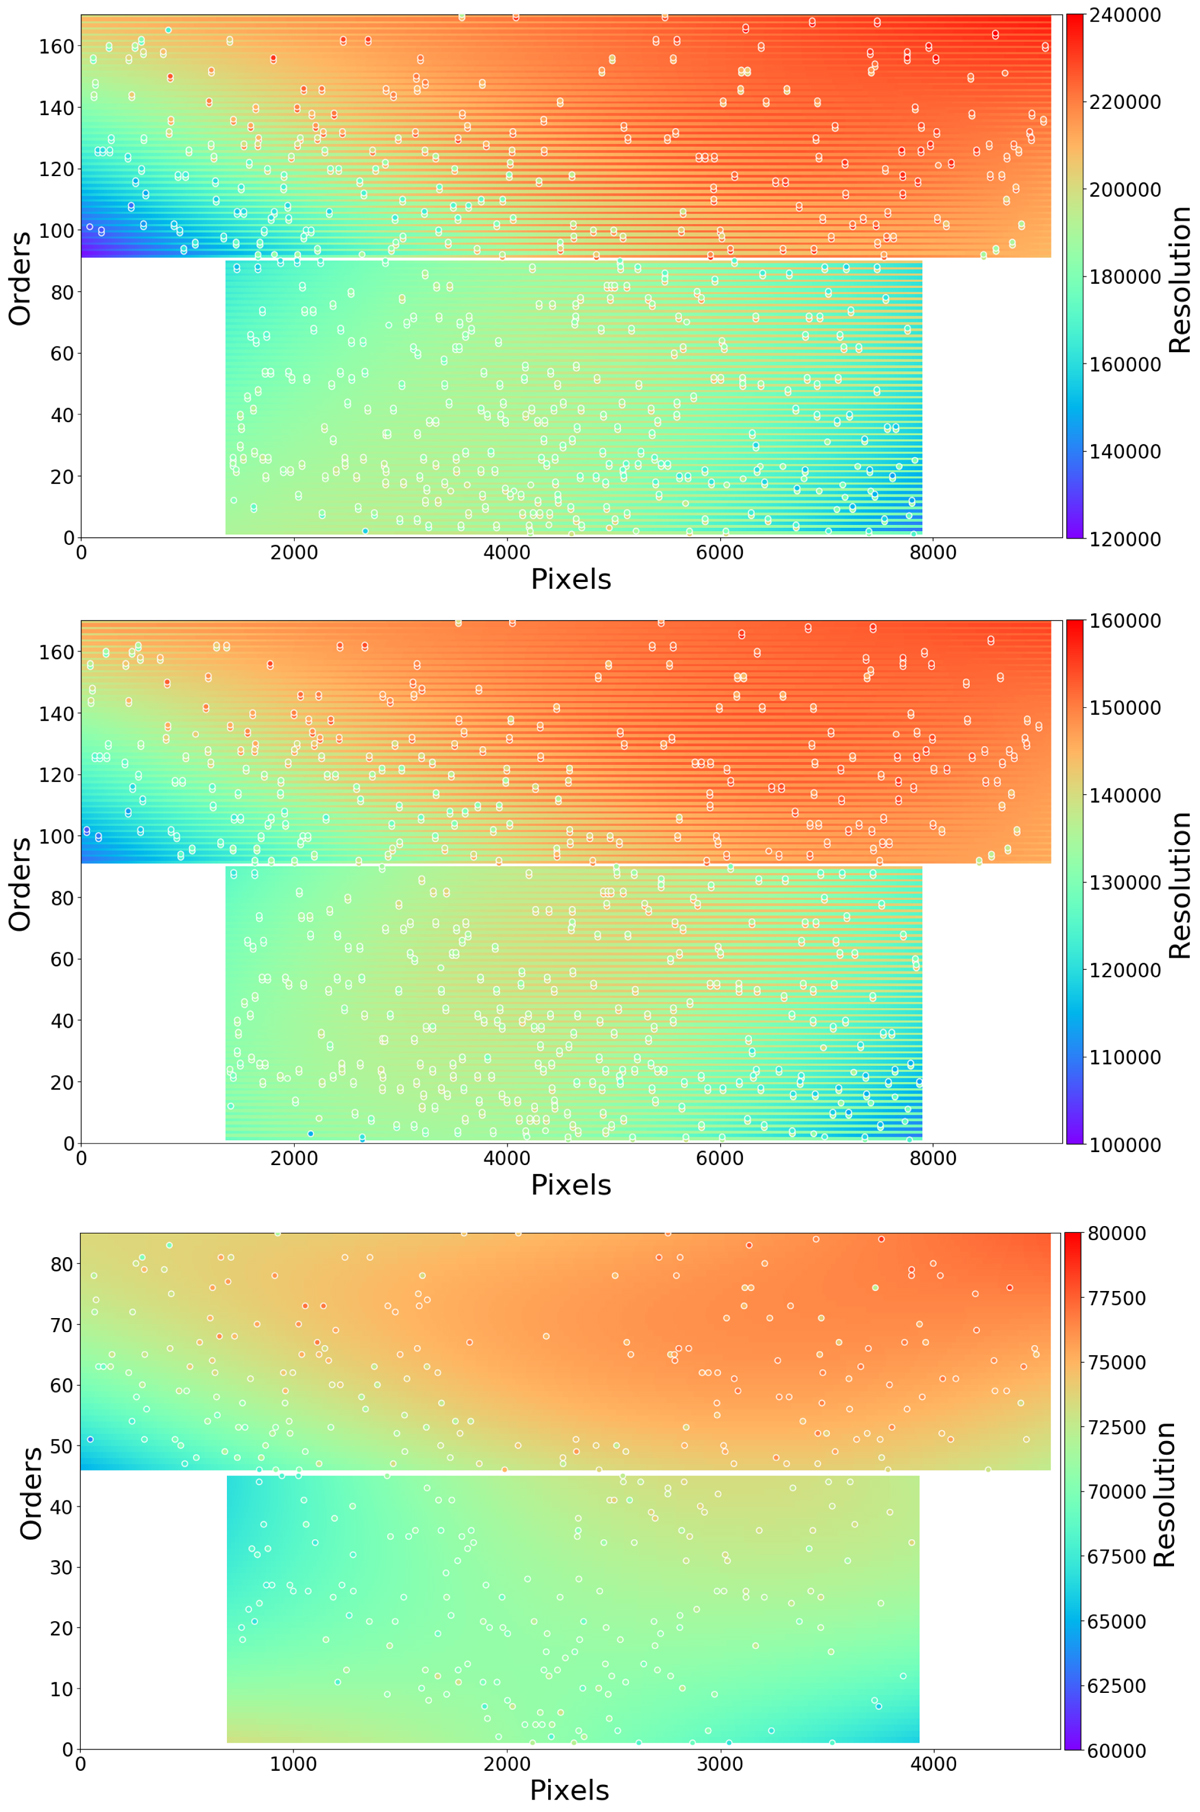
From top to bottom: 2D maps of ESPRESSO’s resolving power for its three instrument modes UHR, HR, and MR. For each mode, the two CCDs are represented (top = red chip, bottom = blue chip). The y-axis does not represent the physical diffraction order number but denotes a continuous (DRS-internal) numbering of every individually extracted slice of each order sorted by increasing wavelength (1 = bluest wavelengths). The white dots show the location of the thorium lines used for the computation of the resolving power. Since in the MR mode the two slices of a given order are merged together by the extraction algorithm, only half the number of orders are present. Their lines have been graphically increased in width to represent the same detector area as the two other modes.
Current usage metrics show cumulative count of Article Views (full-text article views including HTML views, PDF and ePub downloads, according to the available data) and Abstracts Views on Vision4Press platform.
Data correspond to usage on the plateform after 2015. The current usage metrics is available 48-96 hours after online publication and is updated daily on week days.
Initial download of the metrics may take a while.