Fig. 4.
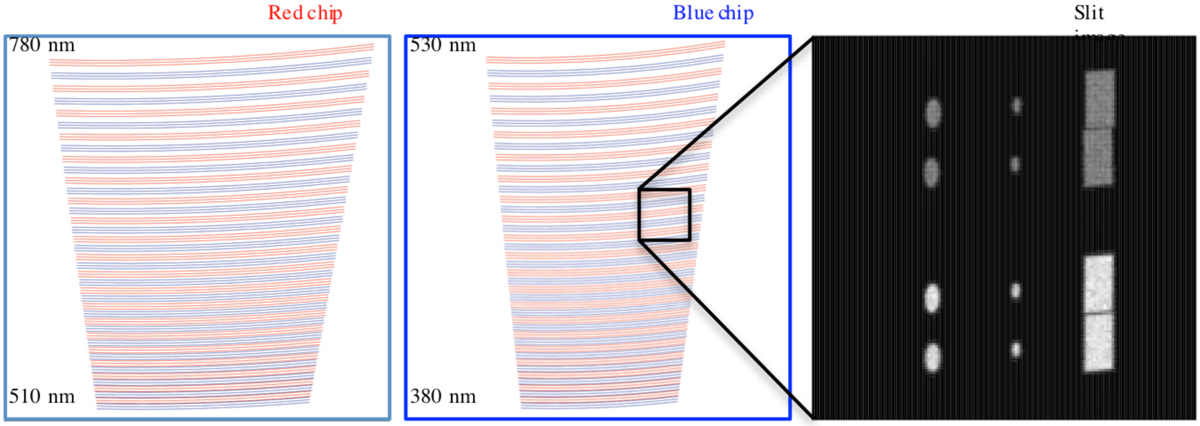
Left: spectral format of the spectrum on the two detectors (90 × 90 mm) showing traces of the various orders over one FSR. To better distinguish neighboring orders, even and odd order numbers have been drawn in blue and red, respectively. Each order is represented by three traces indicating the center of the order in the cross-dispersion direction (vertical), as well as the upper and lower boundaries of the full field produced by the pseudo-slit. Right: zoom-in of the virtual pseudo-slit showing the images of the various fibers projected on the CCDs as if they were simultaneously illuminated by a monochromatic light source. The image covers a square of approximately 120 pixels (1.2 mm) in size on the detector. From left to right: images of the HR, UHR, and MR fibers. For each mode, the lower two images arise from the two slices of fiber A (target) and the upper two from fiber B (reference). In the actual application, only one mode is illuminated at a time, leading to four images (two fiber images × two slices) aligned along the vertical direction (cross-dispersion). The total height of the image determines the width of the echelle order and thus the required cross-dispersion needed to avoid the overlap of neighboring orders on the blue end of the spectral range. This figure is from Pepe et al. (2014).
Current usage metrics show cumulative count of Article Views (full-text article views including HTML views, PDF and ePub downloads, according to the available data) and Abstracts Views on Vision4Press platform.
Data correspond to usage on the plateform after 2015. The current usage metrics is available 48-96 hours after online publication and is updated daily on week days.
Initial download of the metrics may take a while.