Fig. 7.
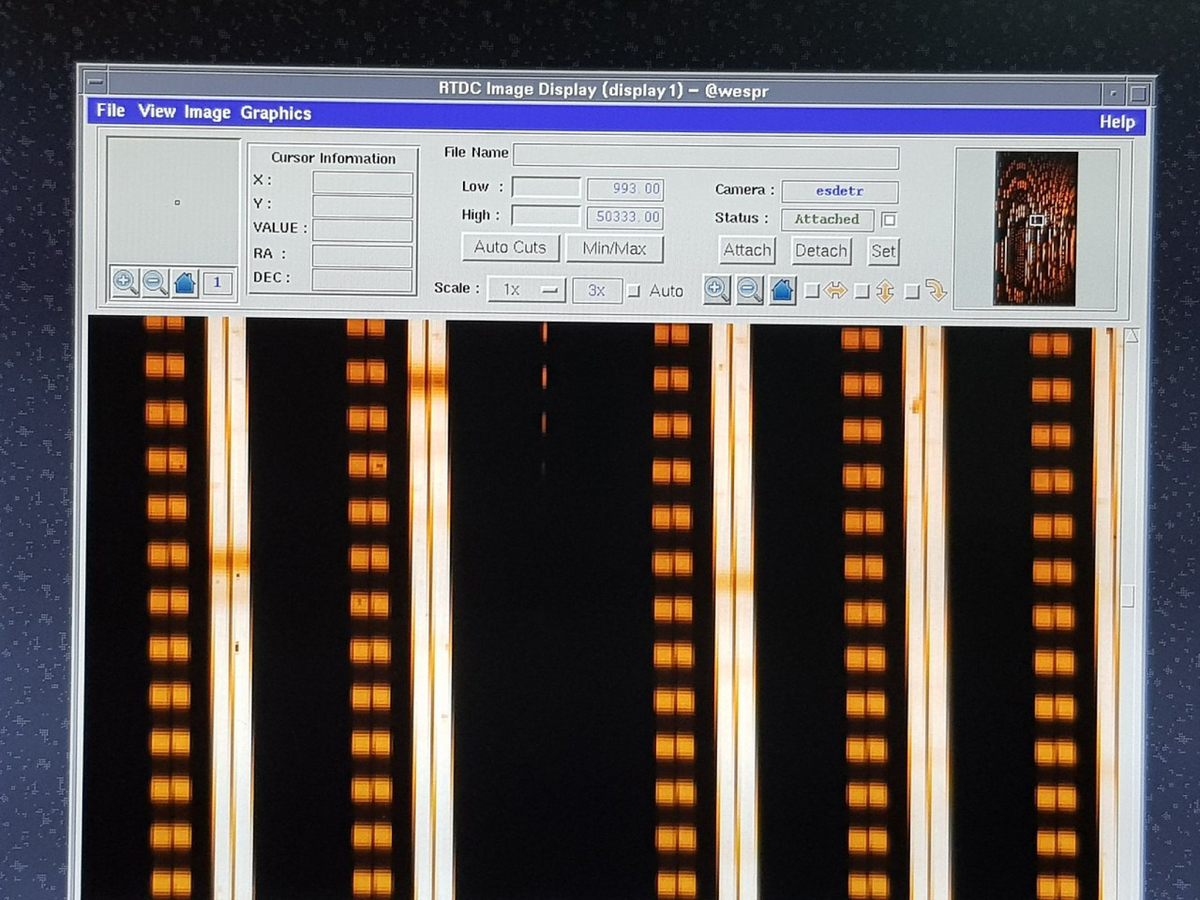
Real-time display of a raw spectrum. A small portion of a star + Fabry-Pérot spectrum acquired in the 4-UT configuration is shown. The main dispersion is vertical. Each order consists of two spectral traces (slices) of the Fabry-Pérot, with its characteristic equidistant spectral lines, and two traces of the stellar spectrum, which essentially plots the continuum with a few absorption features. This figure is best understood when tilted by 90° and compared to Fig. 4.
Current usage metrics show cumulative count of Article Views (full-text article views including HTML views, PDF and ePub downloads, according to the available data) and Abstracts Views on Vision4Press platform.
Data correspond to usage on the plateform after 2015. The current usage metrics is available 48-96 hours after online publication and is updated daily on week days.
Initial download of the metrics may take a while.