Fig. A.1.
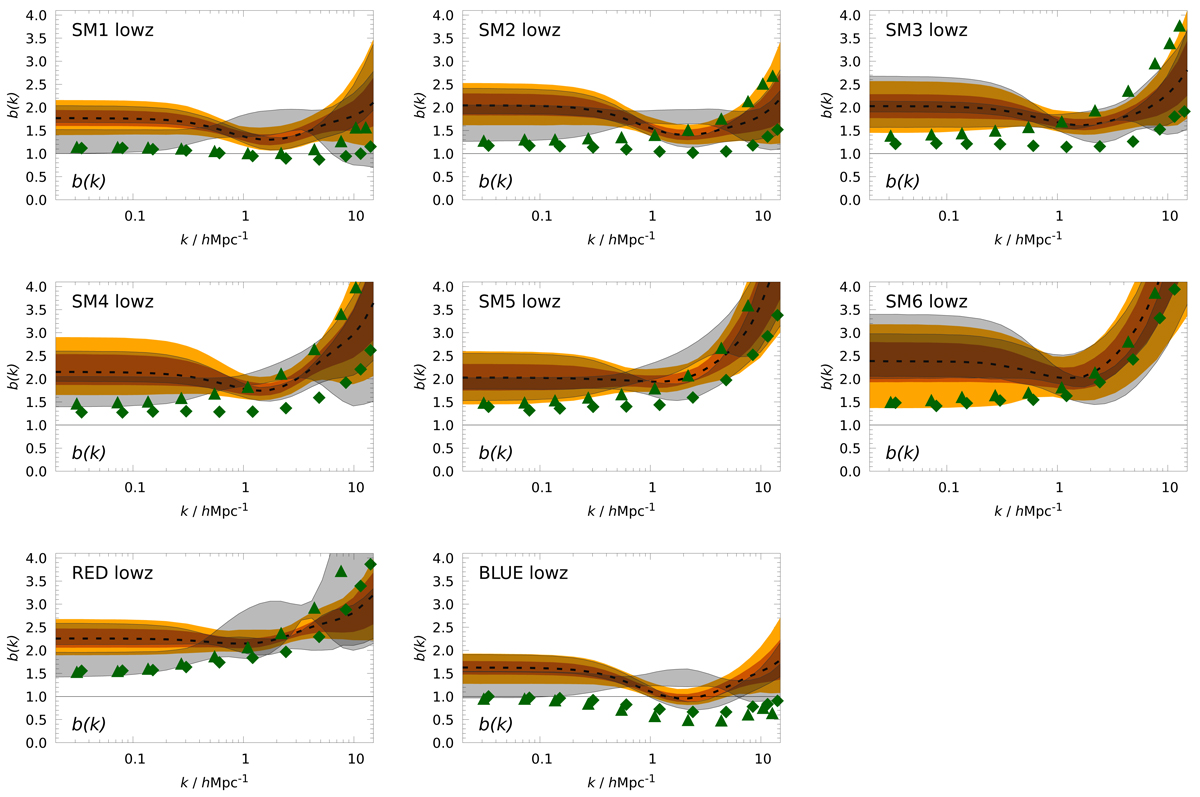
Posterior scale-dependent bias b(k) for galaxy samples at redshift ![]() . The galaxy sample is indicated in the top left corner. The orange filled regions and the dashed lines show the median, 68%, and 95% credible region for the CFHTLenS measurement using the full source sample BACK low-z. The overlapping transparent grey regions show 68% regions that are based on the source subsamples BACKa and BACKb low-z. These noisier measurements at mean source redshifts
. The galaxy sample is indicated in the top left corner. The orange filled regions and the dashed lines show the median, 68%, and 95% credible region for the CFHTLenS measurement using the full source sample BACK low-z. The overlapping transparent grey regions show 68% regions that are based on the source subsamples BACKa and BACKb low-z. These noisier measurements at mean source redshifts ![]() and
and ![]() test the robustness of the measurement. The filled green diamonds and triangles indicate the SAM predictions by H15 and L12, respectively.
test the robustness of the measurement. The filled green diamonds and triangles indicate the SAM predictions by H15 and L12, respectively.
Current usage metrics show cumulative count of Article Views (full-text article views including HTML views, PDF and ePub downloads, according to the available data) and Abstracts Views on Vision4Press platform.
Data correspond to usage on the plateform after 2015. The current usage metrics is available 48-96 hours after online publication and is updated daily on week days.
Initial download of the metrics may take a while.