Fig. E.1.
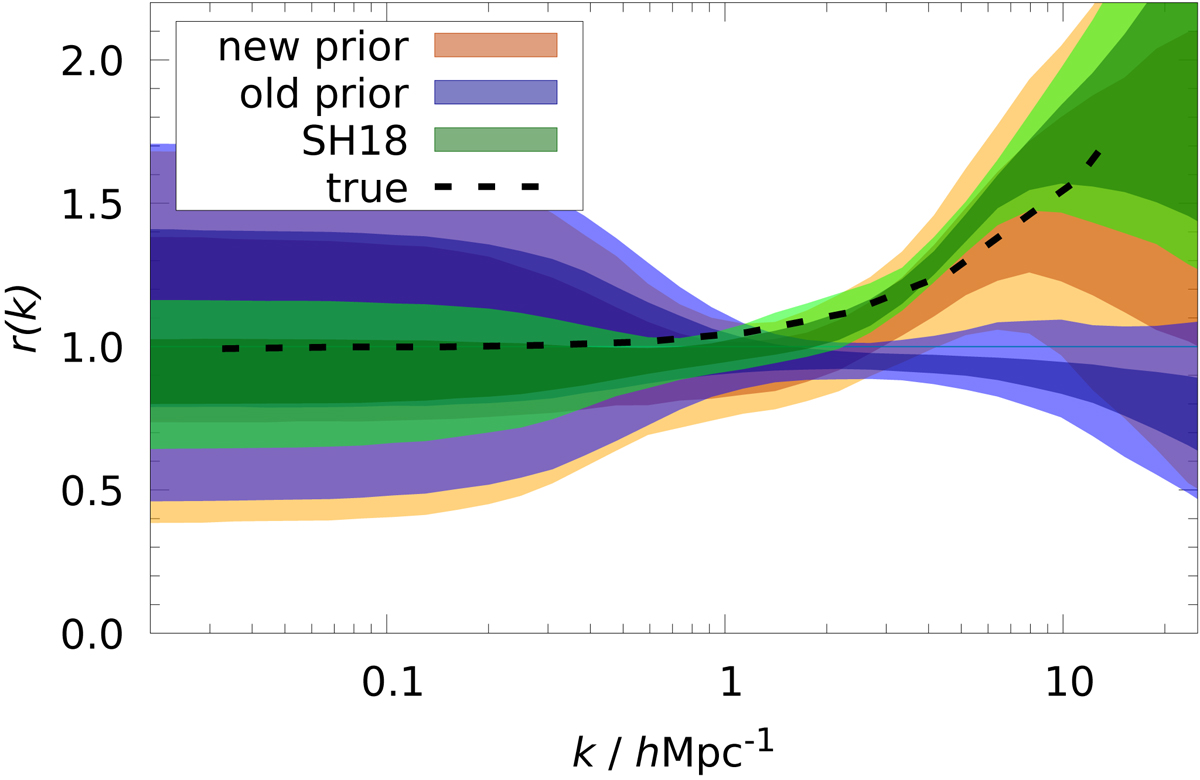
Effect of different b(m) prior distributions on the reconstructed r(k) for CFHTLenS-like noisy data (the orange ‘new prior’ and the blue ‘old prior’) in comparison to the green SH18-like data with high signal-to-noise ratio. The posterior constraints indicate 68% and 95% credibility regions. The dashed line is the true r(k) of the H15 semi-analytic galaxies used in this test (SM4 high-z).
Current usage metrics show cumulative count of Article Views (full-text article views including HTML views, PDF and ePub downloads, according to the available data) and Abstracts Views on Vision4Press platform.
Data correspond to usage on the plateform after 2015. The current usage metrics is available 48-96 hours after online publication and is updated daily on week days.
Initial download of the metrics may take a while.