Fig. F.1.
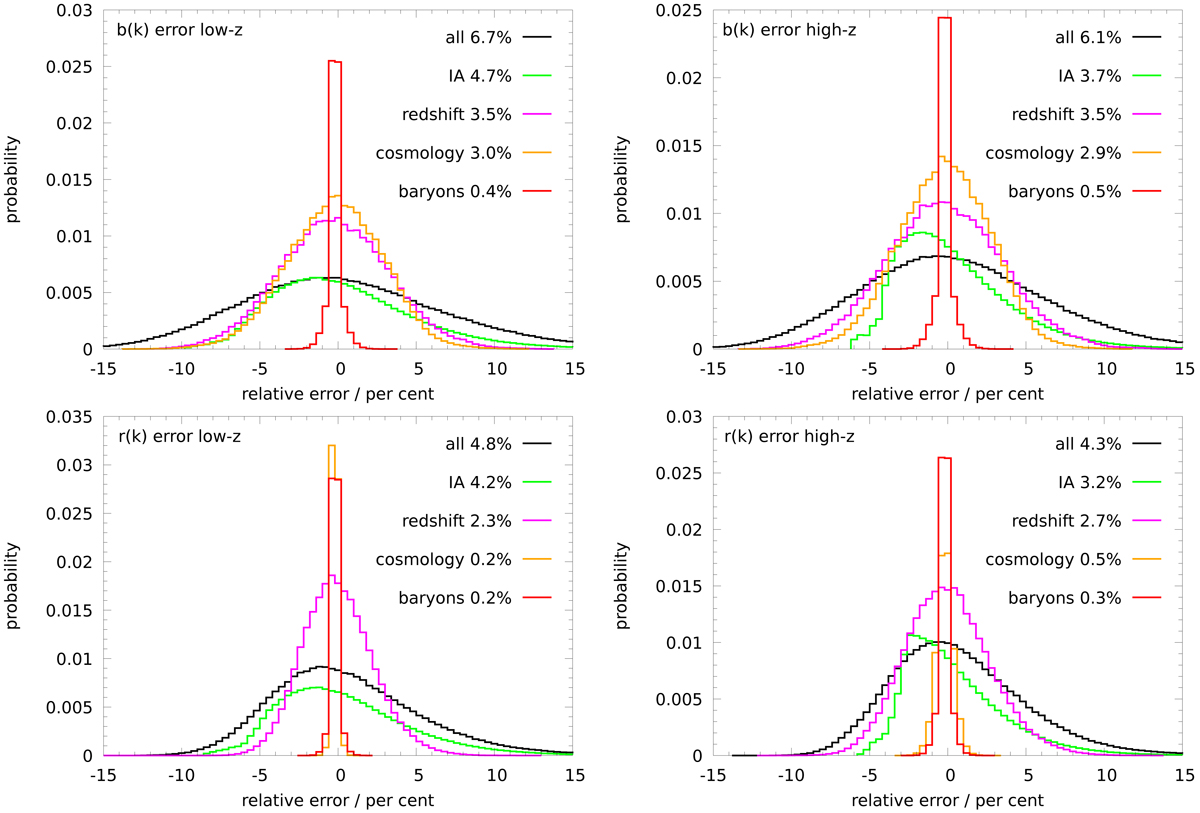
Distribution of fractional errors in the reconstructed b(k) (top) and r(k) (bottom) for unbiased galaxies. The baseline for systematic errors of parameters is summarised in Table 6. The left-hand panels show results for the low-z samples; the right-hand panels are for the high-z samples. The lines labelled ‘all’ (see legend for colours) include errors from all parameters, whereas the other lines show the errors from varying one parameter only. The numbers in each panel’s legend give the RMS error. A positive error means that the inferred galaxy bias is systematically too high on all scales.
Current usage metrics show cumulative count of Article Views (full-text article views including HTML views, PDF and ePub downloads, according to the available data) and Abstracts Views on Vision4Press platform.
Data correspond to usage on the plateform after 2015. The current usage metrics is available 48-96 hours after online publication and is updated daily on week days.
Initial download of the metrics may take a while.