Fig. G.2.
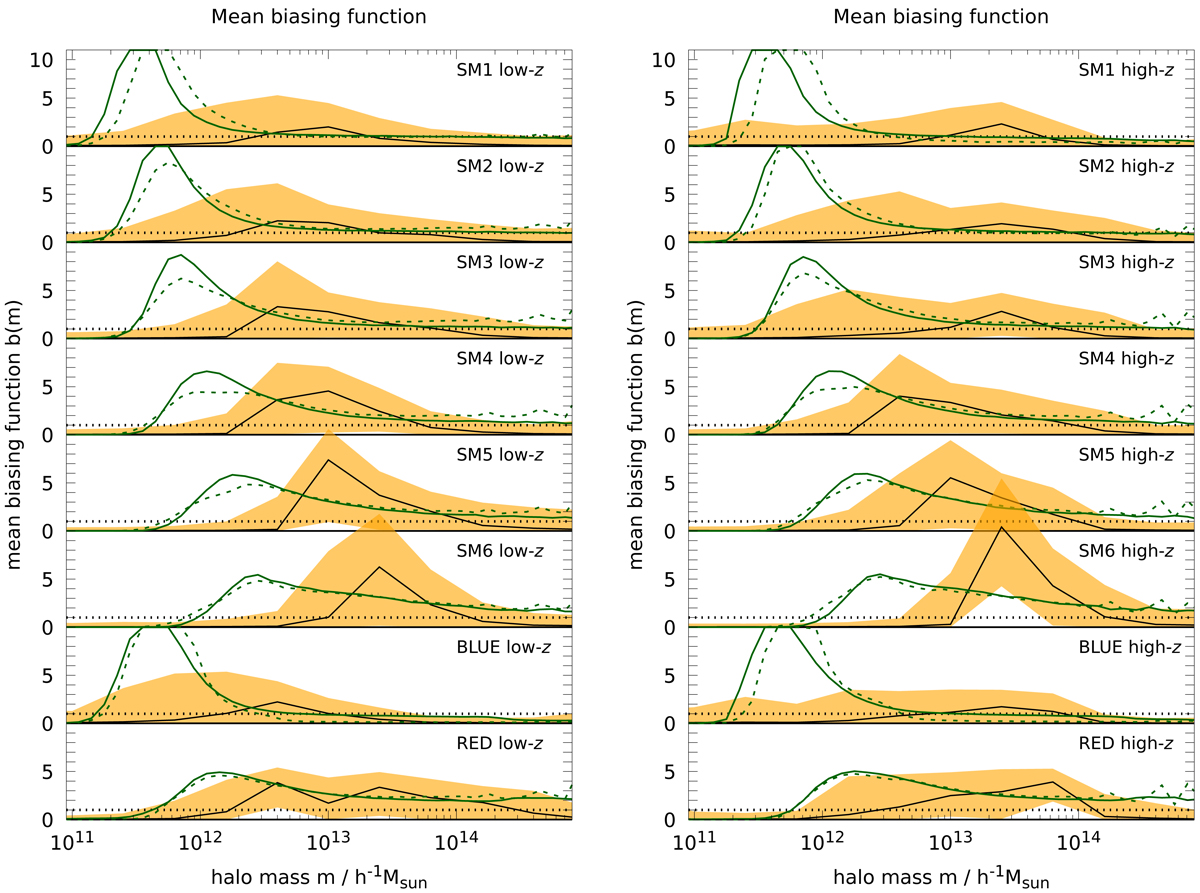
Posterior density of the mean biasing function ![]() as function of halo mass m. The low-z samples are in the left panel, the high-z samples in the right panel. The dotted lines indicate b(m) = 1 for each sample. The shaded regions are the 68% CIs around the median (solid lines). The green lines show for comparison the b(m) in the SAMs (solid line: H15; dotted lines: L12) directly from the ⟨N|m⟩ in the simulation snapshots.
as function of halo mass m. The low-z samples are in the left panel, the high-z samples in the right panel. The dotted lines indicate b(m) = 1 for each sample. The shaded regions are the 68% CIs around the median (solid lines). The green lines show for comparison the b(m) in the SAMs (solid line: H15; dotted lines: L12) directly from the ⟨N|m⟩ in the simulation snapshots.
Current usage metrics show cumulative count of Article Views (full-text article views including HTML views, PDF and ePub downloads, according to the available data) and Abstracts Views on Vision4Press platform.
Data correspond to usage on the plateform after 2015. The current usage metrics is available 48-96 hours after online publication and is updated daily on week days.
Initial download of the metrics may take a while.